Many of us are visual learners, and the monotonous injections of boring verbal information do not stay for long with us. As professionals primarily involved in various data science processes, people have to deal with overwhelming data and interpret information from them. Data visualization is translating data or information into visual form to make it easily understandable.
The main goal of this technique is to make it easy to identify trends, patterns, and outliers in large volumes of data. The data collected is represented using various visual elements like graphs and charts to get quick insights about making a real-time decision.
Frederick Barnard, in 1921 said, “A picture says a thousand words.” Just 100 years later, we are sailing through the authenticity of the statement like never before. Thanks to computing and the internet, we are collecting volumes of information. We are bombarded with heaps of zeroes and ones through tools like Business Intelligence, and analyzing and hoping to find something useful from them does not come naturally to us. Data visualization is the bridge to gap our natural abilities and the demands of today’s data-laden world.
The effectiveness of data visualization
The above statistics affirm that our brains are very much attuned to visuals. So, how is this linked with the transfer of information?
- High-quality infographics are 30 times more prone to be read.
- A piece of scientific information, put on graphs, is acceptable to 97% of people than compared to 68% when placed in mere words.
- People following illustrated versions of the instructions do 323% better than the ones who follow verbose information. Data visualization is an effective way to convey information to the universe visually. The practice helps the businesses identifying the factors affecting customer behavior, pinpoint areas of improvement, understand where and when to place specific products. And predict the volume of sales. Data, in short, becomes more memorable for the stakeholders.
Big Data and Data Visualization
This is the era of big data. Businesses are in need of a versatile data visualization tool that will solve their needs. The effectiveness of any visualization tool or software lies in the abundance of visualization capabilities it offers.
In a business setup, the speed of making decisions is the determining factor of the success of the business. Any question should not remain unanswered for long. While dealing with unknown situations, there should be enough scope to explore and play with the available data in less time taking ways.
Thus, for any visualization tool, the major goals are
- The richness of the capabilities
- Explanation of the information to the users.
Exploration of data, i.e., offering a multi-dimensional perspective of a set of data for the users to explore, reflect and uncover insights
Components of data visualization
A plethora of visualization can be created with the help f the components, which include:
- Time-series visualizations like the area charts and the line charts.
- Part-to-whole views of information.
- Correlation between various variables.
- Geo-mapping like using chloropleths.
- Ranking and comparisons of different types of bars charts.
Types
As already highlighted, the human brains are capable of processing visuals at a very high speed. Why is it so? It takes less than half a second for the brain and the eye to get hold of the pre-attentive visual characteristics of any image-like the form, the color, the movement, and the spatial positioning making up the data visualization.
Charts-The charts used for data visualization are often segregated into categories based on the goals, visual features, and aesthetics. The charts are the perfect tools for visualizing any kind of data, be it discrete or continuous. Let’s try and understand few types.
- Line Chart-The line charts help visualize trends across any span of time.

Line Chart - Area Chart-The area charts are meant for shading the area beneath the lines and thus comparison of data magnitudes becomes easier.
- Stacked Bar Chart- A stacked chart is useful for comparative analysis, especially of parts to the whole in a set of data.
stacked bar charts - Bar Chart-The data is displayed as individual bars here. The heights of the bars are proportional to the values plotted.


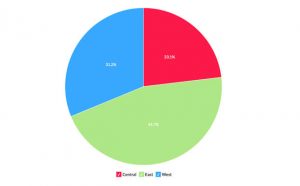
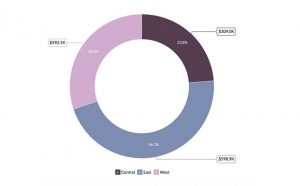
Pie Chart-These charts are appropriate for depicting proportional or percentage of data. It helps in analyzing and estimating the contribution of the parts to a whole set.
- Scatter Chart-When the data available with us is sporadic with uneven intervals, scatter charts are the best. It is used for the comparison between two numerical axes.
- Ring Chart- Another variant of pie charts, these charts are handy for presenting data in parts and percentages.

ring chart - Heat map-These are two-dimensional grid charts, useful for displaying values with colors of various intensities.
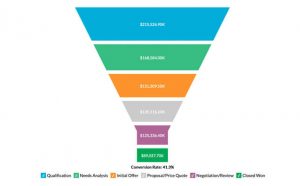
- Funnel Chart- Charts, which help represent a flow in progression or reduction in a business metric across various phases, are known as funnel charts.
funnel chart
Bubble Chart-These charts are help highlight the magnitude of data with proportionate sizing.
-
- Combination Charts-When there are various kinds of data, and you have to display two of them simultaneously, you have to choose a combination chart.
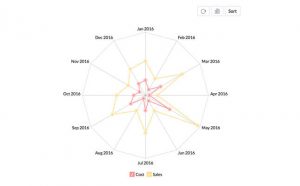
- Web Chart-Choose this chart to study the comparison of various kinds of data series relative to a parameter of comparison.

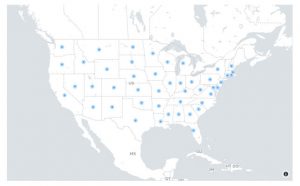
web chart - Geo map-When you have geospatial data with you, geo maps help in visualizing them interactively.

geo map chart - Pivot Tables-A pivot table helps in dynamic rearranging, summarizing, grouping, and tabulating vast amounts of data for easy analysis and consumption. The pivot tables offer a plethora of options to screen, categorize and alter the appearance and presentation of the data in a table.

pivot table - KPI Widgets-Widgets are very much useful to put emphasis on the key metrics in the dashboards so that data can be compared easily. The metrics come with comparison indicators for focusing on the trends.
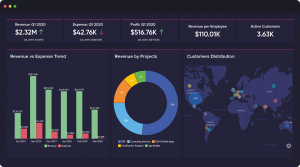
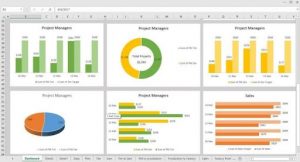
- Dashboards-The dashboards are useful for combining many KPI widgets and multiple reports on a single page. Two advantages are availed this way. You can refer to a single page for a quick overview. Also, the dynamic filtering feature helps in viewing any specific information
Data Visualization Tools
The most common use of data visualization tool is as a Business Intelligence reporting tool. The users can set up intuitive dashboards to keep a tab on the company’s performance, based on the KPIs.
The biggest names in the tools market for data visualization are Microsoft, SAP, IBM, and SAS.
Conclusion
The discussion on data visualization, till now, reflects how huge volumes of data are generated and how they can be put to competitive advantage for the businesses with the help of visualization techniques.
Suppose you are a career-centric person and want to equip yourself with techniques of understanding data, the best ways of representing them, and focus on their distinctiveness. In that case, you have to learn about the approaches for processing information. Why not opt for adequate training for the same from Whizlabs and be industry-ready?
Read more:
Why Microsoft Power Platform is a must skill in 2022?
- Top 45 Fresher Java Interview Questions - March 9, 2023
- 25 Free Practice Questions – GCP Certified Professional Cloud Architect - December 3, 2021
- 30 Free Questions – Google Cloud Certified Digital Leader Certification Exam - November 24, 2021
- 4 Types of Google Cloud Support Options for You - November 23, 2021
- APACHE STORM (2.2.0) – A Complete Guide - November 22, 2021
- Data Mining Vs Big Data – Find out the Best Differences - November 18, 2021
- Understanding MapReduce in Hadoop – Know how to get started - November 15, 2021
- What is Data Visualization? - October 22, 2021