
In the realm of Power BI, there’s a force that empowers developers to transcend the realm of basic data analysis. It’s called DAX, and it holds the key to unlocking detailed insights and dynamic visualizations. With power bi in dax by your side, you can transform raw data into actionable intelligence that drives business decisions.
Whether you need to perform complex calculations, implement time intelligence, or create personalized metrics, DAX empowers Power BI developers to unlock the full analytical potential of their data. Understanding and utilizing DAX effectively is crucial for building insightful and interactive reports in power bi in dax.
In this blog post, we will explore the fundamental concepts of DAX, delve into its syntax and functions, and provide its functionalities and uses of power bi in dax development.
Let’s dive into the Power BI DAX world!
DAX in Power BI
The acronym DAX stands for Data Analysis Expressions, which refers to syntax language that collates formulas and expressions for data manipulation purposes.
In the DAX expression, operators, functions, and constants were utilized. And it is a pro version of Microsoft Excel, which provides higher-level data manipulation as well as data management capabilities.
It serves as a powerful formula language that allows users to create custom calculations, aggregations, and transformations within PowerPivot and Power BI. And it is enriched with a set of functions and operators that can be used to manipulate and analyze data, enabling users to derive meaningful insights from their datasets.
Why Power BI DAX is important?
Power BI offers the capability to generate reports that provide valuable insights from available data. However, when more advanced analysis is required, such as calculating growth percentages across different age groups or comparing annual growth to industry leaders, leveraging DAX Power BI becomes essential.
Power BI DAX formulas enable the creation of custom metrics, unique visualizations, and the ability to address specific queries. By utilizing these advanced calculations, you can gain deep insights into your data, allowing you to solve real business challenges that directly impact your bottom line.
This kind of intelligent approach to data analysis offered by Power BI DAX enhances decision-making and drives smarter business strategies.
DAX Power BI Syntax
Before developing your own Power BI DAX formula, it is essential to comprehend the syntax of DAX formulas. Let’s explore the different components that constitute a DAX formula. For instance, consider this straightforward DAX Power BI formula. The following labels in the diagram depict each syntax element:
- A: It denotes the designation of the measure, metric, or calculation (Total Sales)
- B: It represents the equals sign (=) operator/function, signaling the initiation of the DAX formula.
- C: The DAX function SUM is employed to aggregate all the values within the specified field ([SalesAmount]) of a particular table (Sales).
- D: Parentheses () are used to encapsulate an expression containing one or more arguments.
- E: It signifies the referenced table (Sales).
- F: It represents the referenced column ([SalesAmount]).
Power BI DAX Functions and Formulas
DAX (Data Analysis Expressions) offers a wide range of functions that enable users to perform calculations, aggregations, and transformations in Power BI. Here are some commonly used DAX functions:
| DAX Functions | Description | Functions |
| Aggregate Functions | Aggregate functions in DAX (Data Analysis Expressions) are used to perform calculations on sets of data and return aggregated results. | Here are some commonly used aggregate functions in DAX:
|
| Count functions | These functions in DAX are used to calculate the count of values or rows in a column. | Here are some commonly used count functions in DAX:
|
| Date-Time Functions | This function is used to represent the data and time of the year, month, or day from a date. | DATE, HOUR, TODAY, NOW, EOMONTH |
| Mathematical functions | It is used to do mathematical calculations with the usage of MATH functions. | ABS, EXP, LN, LOG, PI, POWER, QUOTIENT, SIGN, SQRT. |
| Logical functions | It can be used to perform logical operations with the help of operators. | AND, OR, IF, IF ERROR |
| Stat functions | It is generally used to carry out statistical operations. | COMBINE VALUES, CODE EXACT FIND, CONCATENATE, FORMAT, REPLACE, MID, LEFT, RIGHT |
Also Read : Top Power BI interview Question and Answers
How Power BI DAX works?
Power BI’s Data Analysis Expressions (DAX) is the game-changing formula language that brings your data to life. Here’s a sneak peek into how DAX works:
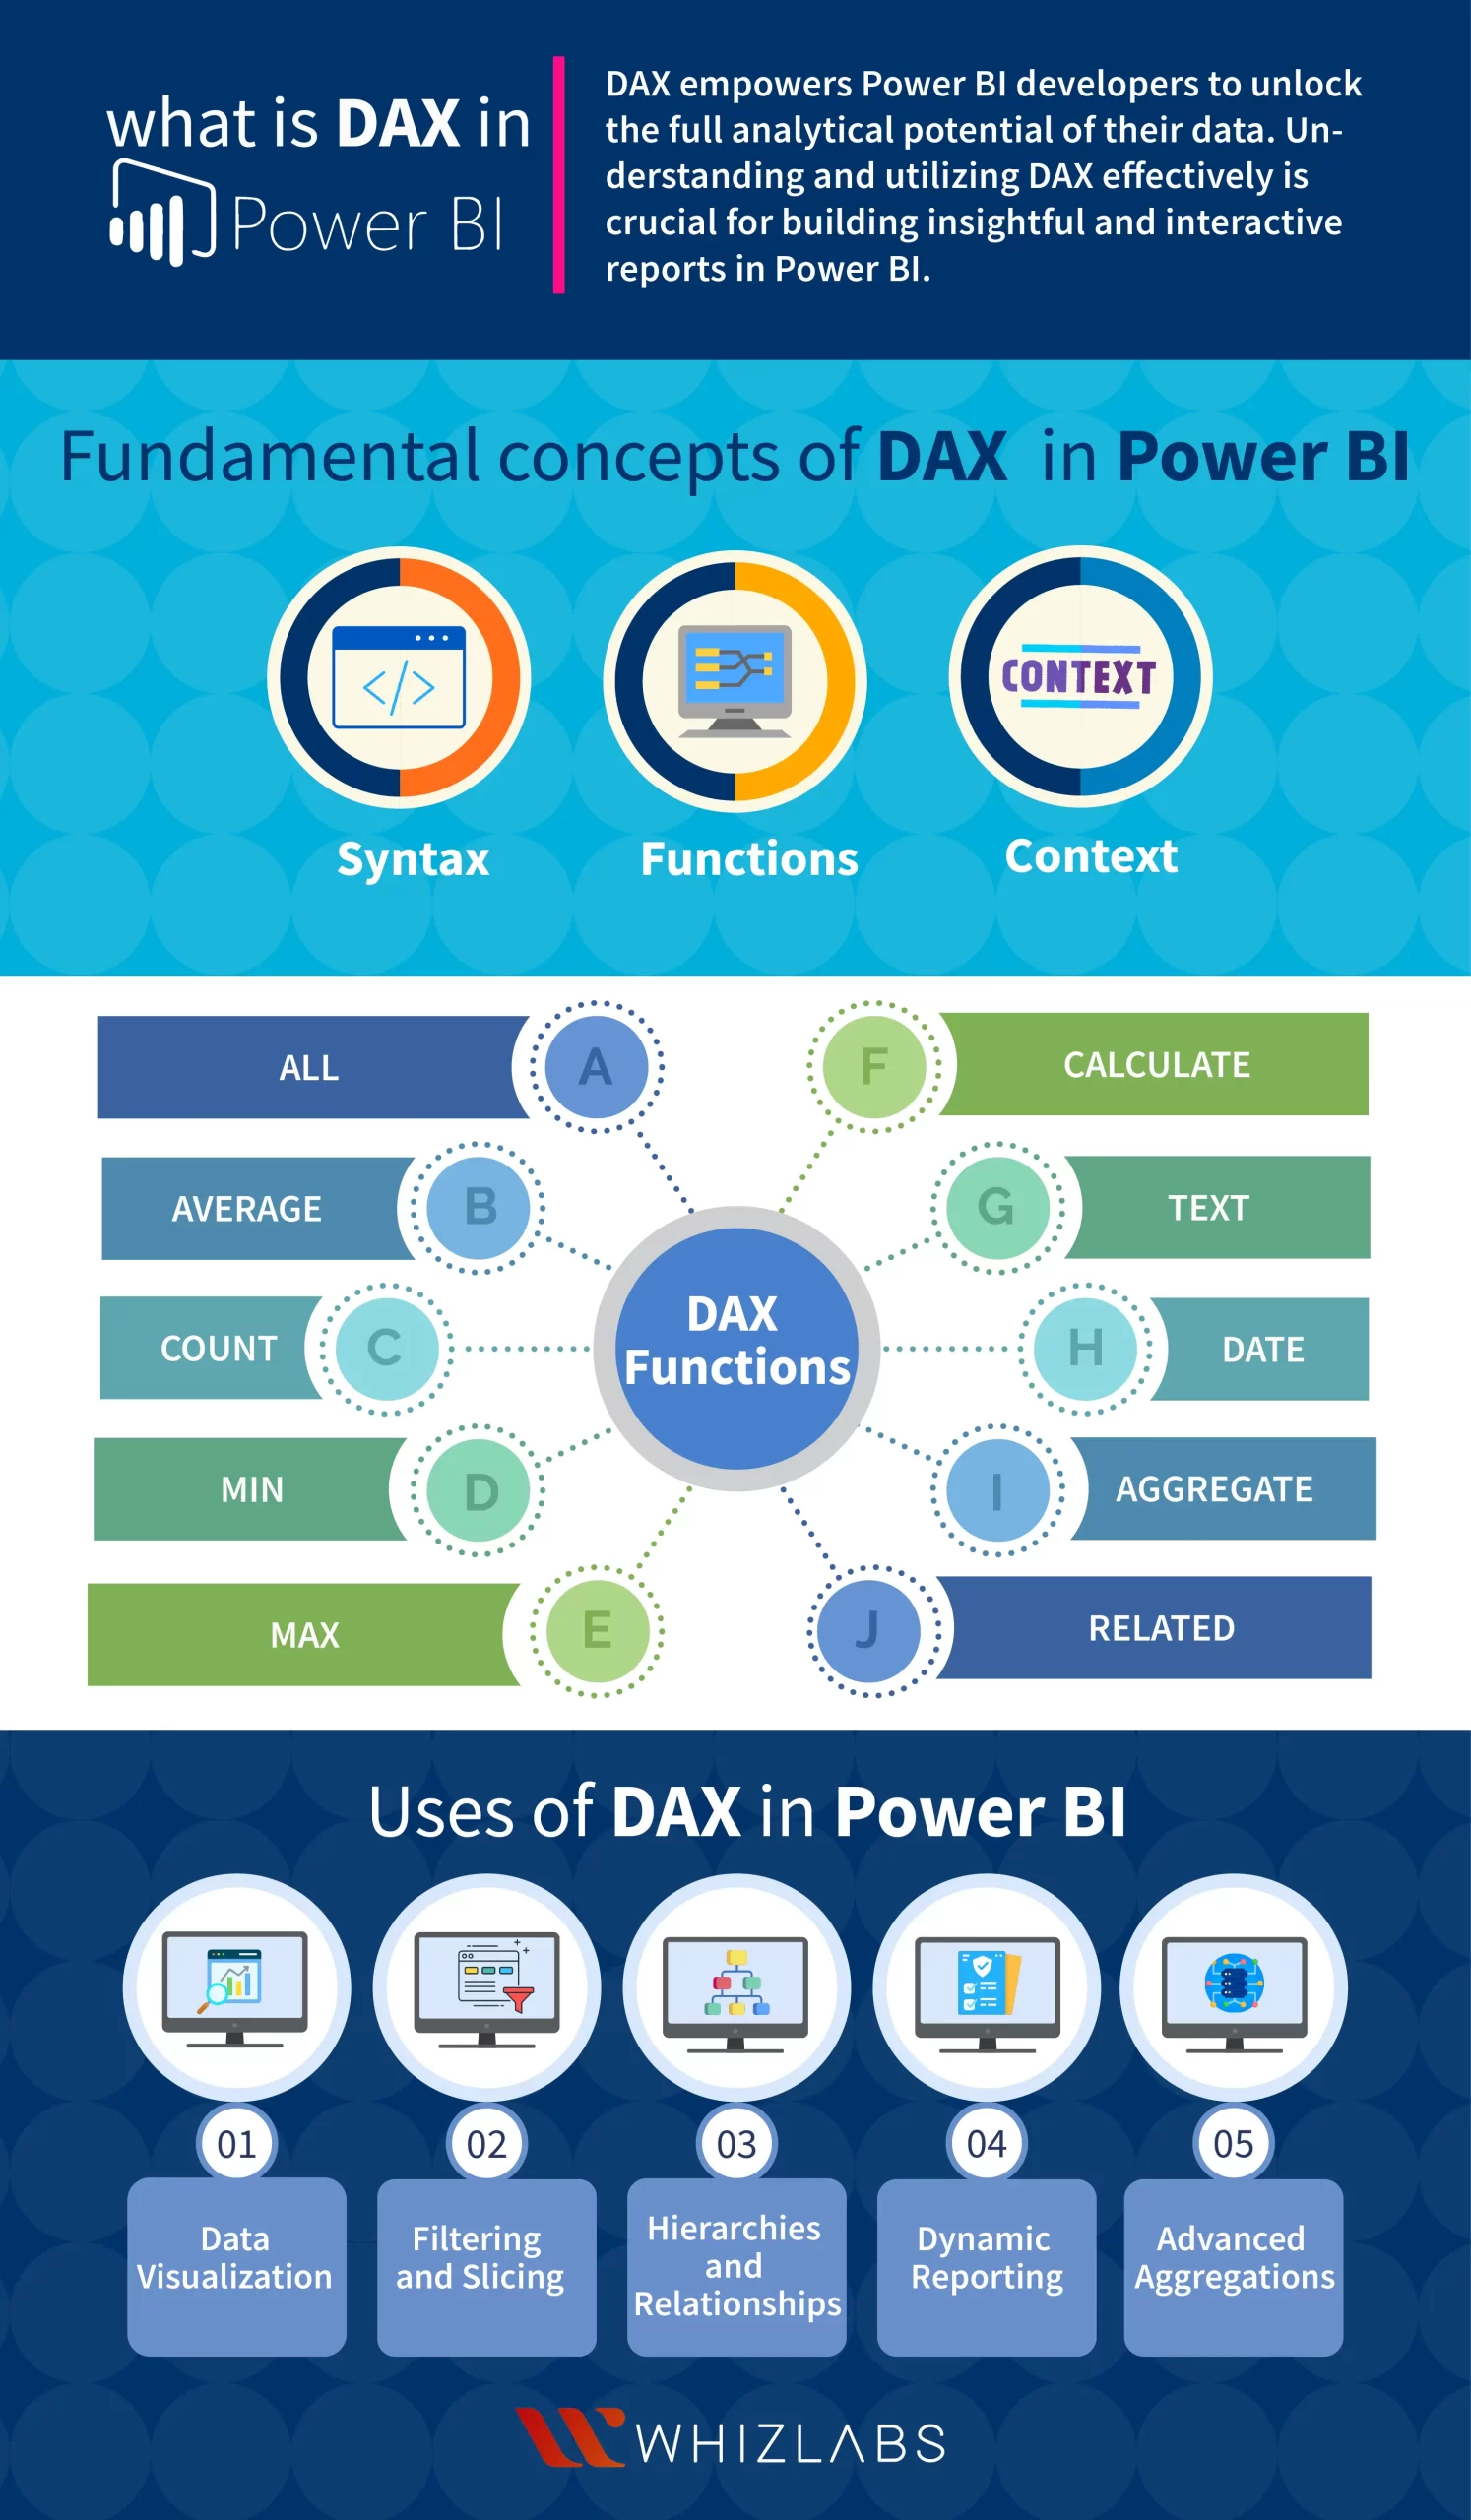
Three vital components make the Power BI DAX work efficiently, which includes:
- Syntax: Formula syntax in Power BI refers to the structure and format of the formulas you create. It represents the language used to construct the formula, including commands, operators, functions, and references to specific columns or rows.
- Functions: It is a predefined, well-structured, and ordered formula and calculations are done with the arguments that are passed to it. The arguments that are passed will be in the form of numbers, text, logical values, or other functions.
- Context: It refers to the row in the formula and its main purpose for insertion is to do the data retrieval or calculation. It gets classified into two contexts: Row Context and Filter Context.
To fetch the input from the user and generate the desired results, the above components are essential.
Power BI DAX: Calculated Columns & Measures
DAX is mainly used to calculate:
- Calculated Column
- Calculated Measures
- Calculated Quick New Measures
- Calculated Table
Now, we are just going to see how Power BI DAX is utilized in calculated columns and measures.
DAX expressions are utilized in both Calculated measures and calculated columns in Power BI, but there are significant differences in their evaluation context. Measures are evaluated within the context of a specific cell in a report or DAX query, while calculated columns are computed at the row level within the table they belong to.
Calculated Columns Vs. Calculated Measures
Although measures and calculated columns may appear similar, their behavior and usage differ significantly. The value of a calculated column is determined during data refresh and relies on the current row as its context. It is not influenced by user interactions within the report.
Calculated columns are particularly useful in the following scenarios:
- Displaying results in a slicer or organizing them in rows or columns within a pivot table, rather than in the values area or chart axes.
- Creating expressions that strictly depend on the current row, such as Price * Quantity, which cannot be applied to an average or sum of the two columns.
- Categorizing text or numbers based on specific ranges or criteria.
On the other hand, measures operate on aggregated data defined by the current context, which is determined by the filters applied in the report. This context includes selections made in slicers, rows, and columns of a pivot table, as well as filters and axes in a chart.
The distinction between measures and calculated columns is vital for leveraging the appropriate evaluation context and achieving accurate and relevant results in Power BI. Understanding when to use calculated columns and when to use measures is essential for effective data modeling and analysis.
Uses of DAX in Power BI
Data Analysis Expressions (DAX) is a powerful formula language used in Power BI for data modeling, calculations, and analysis. Here are some common uses of Power BI DAX:
- Data visualization
- Filtering and Slicing
- Hierarchies and Relationships
- Hierarchies and Relationships
- Dynamic Reporting
- Advanced Aggregations
FAQs
What are the essentials of DAX?
DAX encompasses calculations, functions, relationships, and advanced data manipulation capabilities that empower Power BI developers to derive insights from data, perform complex calculations, and create interactive reports.
What is meant by DAX in Power BI?
DAX refers to the Data Analysis Expressions language, a formula language utilized in Power BI, Power Pivot, and Analysis Services. It enables developers to create sophisticated calculations, custom measures, and data models that enhance data analysis capabilities within Power BI.
What is the DAX function used for?
DAX functions are utilized to perform calculations, filtering, and aggregations on data in Power BI. These functions enable users to transform raw data into meaningful metrics, apply advanced statistical calculations, and perform time intelligence calculations for comparing data over different periods.
What is the DAX formula?
A DAX formula is an expression written in the DAX language. It is used to define calculations and create calculated columns, and measures in Power BI. By leveraging functions, operators, and references to tables and columns, DAX formulas allow users to manipulate and analyze data, derive new insights, and create dynamic visualizations.
What are DAX text functions?
DAX text functions are specifically designed to manipulate and analyze text data within Power BI. These functions allow users to extract substrings, concatenate strings, convert cases, find text patterns, and perform other text-related operations. They provide the flexibility to manipulate and transform textual data for better analysis and visualization within Power BI reports.
Summary
Hope this blog introduced Power BI DAX and took you through various aspects of Power BI DAX in a detailed way.
By understanding and utilizing DAX effectively, Power BI developers can elevate their data analysis capabilities, unlock actionable insights, and create powerful visualizations.
Whether you’re a beginner or an experienced user, mastering DAX opens up a world of possibilities for transforming raw data into valuable business intelligence.
To become familiar with the Power BI DAX, we come up with hands-on labs and sandboxes for you.
If you have any doubts about this blog post, please feel free to ping us!
- Which AWS Certification is Best For Developers - December 5, 2023
- Top Popular Hands on Labs for Google Cloud Platform (GCP) - October 29, 2023
- 7 Exam Tips for Google Cloud Database Engineer Certification - September 21, 2023
- What Is Azure Web Application Firewall (WAF)? - September 8, 2023
- The 5 Best Team Chat Apps for Business in 2024 - August 10, 2023
- What is Microsoft Cybersecurity Reference Architectures? - July 31, 2023
- How to Secure & Migrate your SAP Environment on AWS - July 26, 2023
- A Comparison of SUM-DMO and SWPM - July 21, 2023