
In this article, we are going to learn about a popular monitoring solution for cloud and containers, Prometheus Grafana stack!
Prometheus is an open source application which can scrap the real-time metrics to monitor events and also do real-time alerting.
Grafana is an analytical and visualization tool which is helpful to create interactive charts & graphs from the data and alerts scraped from the monitoring tools.
What is a monitoring stack ?
Monitoring stacks are responsible for analyzing each aspect of how one’s machine has been performing at a given time – whether it’s the percentage of resources being used by processes specifically or if a specific process is crashing & restarting frequently (which may indicate an error or bug), and even stats like who or what process started or shut down over a period of time – they’re constantly watching over the systems to make sure everything is running smoothly and efficiently.
Why do we need a monitoring solution for Cloud & Containers?
Apart from this, there’s yet another reason why monitoring solutions are a necessity nowadays. As the tools and methods get improved, code gets created, tested, and shipped faster, with increased speed comes increased chances of making mistakes! It’s smart not to leave the software to chance! You can always trust your software code… but why take the risk? A monitoring solution helps in just that – by keeping an eye out for potential issues where they usually occur.
Common problems that monitoring solutions can detect –
- Infrastructure failure due to an outage
- Resource wastage due to low utilization
- No space left on disk
- Communication failure due to network outage
- API errors due to code bugs
The most widely used monitoring solution for cloud and containers is – Prometheus-Grafana stack.
Prometheus Grafana stack
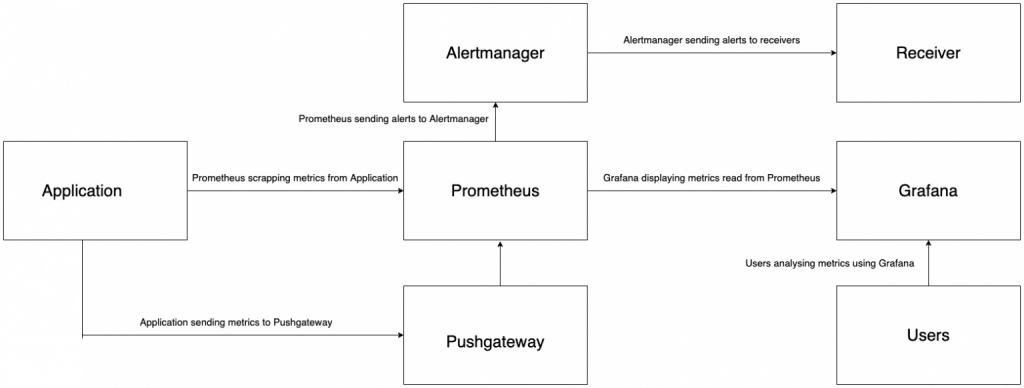
It’s actually comprised of four components:-
- Prometheus: It gets the metrics data from the application & stores it.
- Grafana: Takes data from Prometheus to display on multiple visualizations.
- Alert Manager: Gets alerts from Prometheus & sends notifications.
- Push gateway: Adds support for metrics that cannot be scrapped.
How does Prometheus work with Grafana?
End-to-end Flow
Prometheus scrapes metrics from a variety of application endpoints and stores them in its internal database. Grafana then reads these metrics from Prometheus and displays visualizations and dashboards based on these metrics on its UI. Prometheus alerts can also be configured to send notifications to external systems, such that when an event occurs, Prometheus sends the alert data to the Alertmanager which in turn dynamically routes the alerts to different receivers such as email, Slack, or PagerDuty.
Some applications do not tell you their metrics via dedicated endpoints and instead rely on an additional component called “exporter” to get their job done. An exporter reads internal data of a particular process and then exposes them through the given endpoint. They are used widely by many popular databases such as Postgres, Redis, etc.
For metrics that don’t work with the push model of Prometheus up, a push gateway is utilized.
In this article, we are going to see the important features & installation procedures for these components. Though these components can be installed on any operating system, here – we are going to install them on Ubuntu 20 which is one of the best linux os for programming.
In this article, we are going to lay out the use case of each component and the steps on how to set up a complete monitoring solution. We’re using Ubuntu 20 here as an operating system; however, one can also use them in other operating systems as well.
Let’s start with a quick guide !
Prometheus – How does it work?
It works by pulling/scrapping real-time metrics from applications at regular intervals of time by sending HTTP requests on metrics endpoints of applications. After the data is collected, it stores them in an internal time-series database.
What makes it the de facto monitoring tool?
There are two reasons –
- Its simple yet powerful data model and query language provide detailed and actionable metrics for the analysis of application and infrastructure performance.
- It doesn’t require installation of any custom software or configuration on servers, or even in container images to enable collecting metrics.
How to install Prometheus?
Let’s go over the step-by-step procedure.
1. Add prometheus user:
sudo useradd --no-create-home prometheus
2. Download and install the Prometheus binary:
sudo mkdir /etc/prometheus
sudo mkdir /var/lib/prometheus
wget https://github.com/prometheus/prometheus/releases/download/v2.30.3/prometheus-2.30.3.linux-amd64.tar.gz
tar -xvf prometheus-2.30.3.linux-amd64.tar.gz
3. Copy files from prometheus setup:
sudo cp prometheus-2.30.3.linux-amd64/prometheus /usr/local/bin
sudo cp prometheus-2.30.3.linux-amd64/promtool /usr/local/bin
sudo cp -r prometheus-2.30.3.linux-amd64/consoles /etc/prometheus/
sudo cp -r prometheus-2.30.3.linux-amd64/console_libraries /etc/prometheus
sudo cp prometheus-2.30.3.linux-amd64/promtool /usr/local/bin/
4. Adding content to prometheus’s configuration file:
- This is where we configure the time intervals in which prometheus will scrap the metrics.
- Here, we are telling prometheus to scrape the metrics it is generating. So that we can use these metrics later on.
global:
  scrape_interval: 15s
  external_labels:
    monitor: 'prometheus'
scrape_configs:
  - job_name: 'prometheus'
    static_configs:
      - targets: ['localhost:9090']
5. Give user ‘prometheus’ the permission to the file used to run prometheus server.
sudo chown prometheus:prometheus /etc/prometheus
sudo chown prometheus:prometheus /usr/local/bin/prometheus
sudo chown prometheus:prometheus /usr/local/bin/promtool
sudo chown -R prometheus:prometheus /etc/prometheus/consoles
sudo chown -R prometheus:prometheus /etc/prometheus/console_libraries
sudo chown -R prometheus:prometheus /var/lib/prometheus/
6. Add the prometheus startup in the service script.
- So that we can start, stop, restart & check its status easily.
sudo vim /etc/systemd/system/prometheus.service
A service unit describes a service or application on the machine will be managed. It includes instructions for starting or stopping the service and many other things.
[Unit]
Description=Prometheus
Wants=network-online.target
After=network-online.target

[Service]
User=prometheus
Group=prometheus
Type=simpleExecStart=/usr/local/bin/prometheus --config.file /etc/prometheus/prometheus.yml --storage.tsdb.path /var/lib/prometheus/ --web.console.templates=/etc/prometheus/consoles --web.console.libraries=/etc/prometheus/console_libraries

[Install]
WantedBy=multi-user.target
7. Run the following to add the above service unit and start prometheus.
sudo systemctl daemon-reload
sudo systemctl enable prometheus
sudo systemctl start prometheus
sudo systemctl status prometheus
The installation is complete. Prometheus occupies port 9090 by default.
Grafana – A short tutorial
What is Grafana?
Grafana is an open-source tool for displaying visualizations and metrics for analysis that support many 3rd party data sources such as Elasticsearch, Influxdb, Graphite, Prometheus, AWS Cloud Watch, and many others.
How does it work?
Grafana can be thought of as the frontend of the monitoring solution i.e. it reads metrics data from Prometheus and displays the metrics in an organized fashion to the user via visualization and graphs.
How to install Grafana?
Let’s go over the step-by-step procedure.
1. Add grafana’s required user:
sudo apt-get install -y adduser libfontconfig1
2. Download & install Grafana binary:
wget https://dl.grafana.com/oss/release/grafana_8.2.2_amd64.deb
sudo dpkg -i grafana_8.2.2_amd64.deb
3. Run the following to add the above service unit and start grafana.
sudo systemctl daemon-reload
sudo systemctl start grafana-server
sudo systemctl status grafana-server
sudo systemctl enable grafana-server.service
The installation is complete. Grafana occupies port 3000 by default.
Alertmanager
How does alerting work?
In a monitoring solution, the most crucial task is of alerting. Metrics collected are analyzed by Prometheus, If it finds something out of order such as memory utilization too high or too many process restarts then it triggers an alert so that a human intervenes.
What is the role of an Alertmanager?
This alerting mechanism is handled by the Alertmanager i.e. Prometheus sends alerts to the Alertmanager, which then sends out a notification requesting human intervention.
How does Alertmanager help?
It takes care of deduplicating, grouping, and routing the alerts to the correct receiver endpoints such as email, PagerDuty, or Slack. It also takes care of silencing and inhibition of alerts. In this way, it helps keep the monitoring solution efficient and reliable.
How do we install Alertmanager?
Let’s go over the step-by-step procedure.
1. Add an alertmanager user:
sudo useradd --no-create-home alertmanager
2. Download and install the Prometheus binary:
wget https://github.com/prometheus/alertmanager/releases/download/v0.23.0/alertmanager-0.23.0.linux-amd64.tar.gz
tar xvfz alertmanager-0.23.0.linux-amd64.tar.gz
3. Create folders for use by alertmanager
sudo mkdir -p /var/lib/alertmanager
sudo mkdir -p /etc/alertmanager
3. Copy files for alertmanager setup:
sudo cp alertmanager-0.23.0.linux-amd64/alertmanager /usr/local/bin/
sudo cp alertmanager-0.23.0.linux-amd64/alertmanager.yml /etc/alertmanager
4. Assign ownership of files to alertmanager user
sudo chown alertmanager:alertmanager /usr/local/bin/alertmanager
sudo chown -R alertmanager:alertmanager /etc/alertmanager
5. Create a service file
sudo vim /etc/systemd/system/alertmanager.service
Contents –
[Unit]
Description=Prometheus Alertmanager
Wants=network-online.target
After=network-online.target

[Service]
User=alertmanager
Group=alertmanager
Type=simple
WorkingDirectory=/etc/alertmanager/
ExecStart=/usr/local/bin/alertmanager
--config.file /etc/alertmanager/alertmanager.yml
--storage.path /var/lib/alertmanager/

[Install]
WantedBy=multi-user.target
6. Run the following to add the above service unit and start alertmanager.
sudo systemctl daemon-reload
sudo systemctl enable alertmanager
sudo systemctl start alertmanager
sudo systemctl status alertmanager
The installation is complete. Alertmanager occupies port 9093 by default.
Push gateway
The Pushgateway is an intermediary component that allows the pushing of metrics from endpoints that cannot be scrapped.
When are they required?
In cases where applications die before they even have the chance to let Prometheus find them. For example, if you are using Kubernetes service discovery, and your pods do not live enough to be picked up by Prometheus. Then the typical pull model of Prometheus does not fit anymore because Prometheus cannot find or scrape all of the targets
What does it do?
You can send metrics data to the Pushgateway from your script’s output that might have been cut off early, after which the metrics will be eventually ingested by Prometheus.
How do we install Pushgateway?
Let’s go over the step-by-step procedure.
1. Add a pushgateway user
sudo useradd --no-create-home pushgateway
2. Download and install the Prometheus binary:
wget https://github.com/prometheus/pushgateway/releases/download/v1.4.2/pushgateway-1.4.2.linux-amd64.tar.gz
tar xvfz pushgateway-1.4.2.linux-amd64.tar.gz
3. Copy files for pushgateway setup:
sudo cp pushgateway-1.4.2.linux-amd64/pushgateway /usr/local/bin/
4. Assign ownership of files to pushgateway user:
sudo chown pushgateway:pushgateway /usr/local/bin/pushgateway
5. Create a service file
sudo vi /etc/systemd/system/pushgateway.service
Contents:
[Unit]
Description=Prometheus Pushgateway
Wants=network-online.target
After=network-online.target

[Service]
User=pushgateway
Group=pushgateway
Type=simple
ExecStart=/usr/local/bin/pushgateway

[Install]
WantedBy=multi-user.target
6. Run the following to add the above service unit and start pushgateway.
sudo systemctl daemon-reload
sudo systemctl enable pushgateway
sudo systemctl start pushgateway
sudo systemctl status pushgateway
The installation is complete. Pushgateway occupies port 9091 by default.
Accessing the UI of these components
For accessing the UI of each component, the port must be reachable from outside the server. The way to do differs in each cloud provider. For e.g. In AWS, we need to add an entry for the corresponding ports in the security group and make it accessible from anywhere.
Final words
Until now, we have understood the function and use case of each component in the monitoring solution, as well as went through the importance of the whole monitoring solution in general.
We encourage you to explore more about the components we have described in this tutorial so that you can do some hands-on exercises as well. Why not try connecting Grafana with Prometheus and set up alerts from Alertmanager to Prometheus? Or even attempt something such as setting up alert receivers in AlertManager?
These monitoring tools for cloud and containers are so priceless that they’re like the Swiss army knife of every team! These tools will never go out of application stacks! They’re essential to almost every team, so make sure you know how to use them properly.
- NGINX Tutorial for Beginners (NEW) – Learn for FREE ! - February 21, 2022
- The Beginner’s Guide to Helm Charts - February 16, 2022
- The Complete Guide to Kubernetes Logging - January 14, 2022
- Explained: Kubernetes Architecture - January 12, 2022
- Top 15 Important Kubectl Imperative Commands in Kubernetes [CHEAT SHEET] - January 12, 2022
- What is Prometheus Grafana Stack ? - December 28, 2021
- How to prepare for the Certified Kubernetes Application Developer (CKAD) Exam? - December 6, 2021
Really easy to understand tutorial and really loved the explanation of the cloud.
5 stars from me.
Such clear explanation.
Amazing write-up!
Very informative.