Application logs are your best friend when it comes to troubleshooting problems in your application. If you’re working with containerized workloads and using Kubernetes, it’s especially important for you to have a good sense of how logging works because it can help you set up the logging solutions in the right way & make better use of logging.
This article is a deep dive into Kubernetes logging architecture. This article would be especially informative for those unfamiliar with the complexities of working in Kubernetes.
Kubernetes Logging Architecture
The following points talk about Kubernetes Logging Architecture. Going through them is crucial in order to understand other concepts related to logging in Kubernetes.
- A container writes messages about the current tasks that the process in the container is working at. In Kubernetes, these messages are taken up by the container runtime engine of the nodes and directed to a JSON file on the nodes.
- In a cluster, some components run as a container (inside a pod) while others run as systemd process on the node. Both generate logs.
- Components such as kube-apiserver, kube-scheduler, kube-proxy and etcd run as containers. Their logs can be viewed using the kubectl commands, which in turn returns the logs from the JSON file on the nodes.
- Components such as kubelet, container runtime engines run as systemd processes on the nodes. Their logs can be viewed using the journalctl methods.
- The following command can be used to view the logs.
# In order to see logs saved in JSON file on the nodes -
kubectl log <pod-name> -c <container-nam

# In order to see logs generated by the cluster's systemd processes -
Jounalctl -PID=<process-id>
Demo
While learning Kubernetes, it is good to know the theory and better to see things practically.
Let’s use minikube to practically see the files & try the commands discussed above.
- Install minikube by following the guide here – Guide to minikube installation
- Start minikube
minikube start - Start a pod
kubectl run nginx –image=nginx - View logs of the pod
kubectl logs nginx -c nginx - Sample output
... /docker-entrypoint.sh: Launching /docker-entrypoint.d/30-tune-worker-processes.sh /docker-entrypoint.sh: Configuration complete; ready for start up 2022/01/13 20:12:04 [notice] 1#1: using the "epoll" event method 2022/01/13 20:12:04 [notice] 1#1: nginx/1.21.5 2022/01/13 20:12:04 [notice] 1#1: built by gcc 10.2.1 20210110 (Debian 10.2.1-6) 2022/01/13 20:12:04 [notice] 1#1: OS: Linux 4.14.209-160.339.amzn2.x86_64 2022/01/13 20:12:04 [notice] 1#1: getrlimit(RLIMIT_NOFILE): 1048576:1048576 2022/01/13 20:12:04 [notice] 1#1: start worker processes 2022/01/13 20:12:04 [notice] 1#1: start worker process 30 2022/01/13 20:12:04 [notice] 1#1: start worker process 31 2022/01/13 20:12:04 [notice] 1#1: start worker process 32 ... - The logs output by the command is being read from the JSON file on the node.
- SSH into minikube node
minikube ssh - Fing process id of kubelet
ps aux | grep kubelet - Check logs of the kubelet process
sudo journalctl _PID=1063 - Sample output
...
Jan 13 18:56:51 minikube kubelet[1063]: I0113 18:56:51.804293 1063 server.go:440] "Kubelet version" kubeletVersion="v1.21.2"
Jan 13 18:56:51 minikube kubelet[1063]: I0113 18:56:51.804959 1063 server.go:851] "Client rotation is on, will bootstrap in background"
Jan 13 18:56:51 minikube kubelet[1063]: I0113 18:56:51.807635 1063 certificate_store.go:130] Loading cert/key pair from "/var/lib/kubelet/pki/ku
belet-client-current.pem".
Jan 13 18:56:51 minikube kubelet[1063]: I0113 18:56:51.813472 1063 dynamic_cafile_content.go:167] Starting client-ca-bundle::/var/lib/minikube/c
erts/ca.crt
Jan 13 18:56:51 minikube kubelet[1063]: W0113 18:56:51.888596 1063 sysinfo.go:203] Nodes topology is not available, providing CPU topology
...
- The logs output by the command is from the journalctl of the node.
Deep dive about the container logs
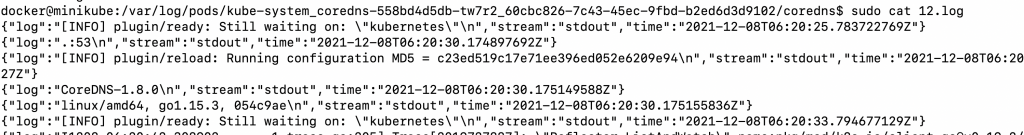
The container logs are saved in a JSON file on the nodes. The container writes these files in a standard format containing –
- Log: The actual message from the container.
- Stream: The stream type i.e. standard output (stdout) or standard error (stderr).
- Time: The timestamp of the log.
Format:
{
   “log” : “<log message from a container>”,
   “stream” : “<stream type>”,
   “time” : ”<timestamp>”
}
Example :
{
    "log" : "listening on port 8080”,
    "stream" : "stdout",
    "time" : "2021-08-31T16:35:59.5109491Z"
}
Let’s see how we can view these JSON files in the node.
- SSH into minikube
minikube ssh
- Go to the /var/log/pods directory
cd /var/log/pods
- Each directory here follows a format of “<namespace>_<pod-name>_<pod-id>”

- Each file inside a directory represents the container inside the pod, it follows the format of “<container-name>.log”

- Each .log file here contains multiple logs in the JSON format as discussed above.


Logging challenges
Relying on the kubectl commands or the journalctl command to view the logs is not an efficient solution due to a variety of reasons
- It becomes difficult to cross analyze logs from different containers and processes with these commands.
- It’s not possible to view logs from a particular point in time with these commands. These commands output only the latest logs.
Due to these reasons, it is common to deploy a third-party solution that makes the management of logs easier and the viewing of logs simple.
Logging solutions
There is a variety of solutions available for kubernetes logging.
- An example of an open-source logging solution could be – elastic stack.
- An example of enterprise-level logging solutions is – logz.io, Splunk, SumoLogic, etc.
- An example of cloud service-provided solutions is – Cloudwatch by AWS, Stackdriver monitoring by GKE, Monitor by Azure, etc.
Out of these, the elastic stack is the most widely used solution.
Elastic Stack
The elastic stack has the following components-
- Agent: It is responsible for exporting logs from the Kubernetes cluster to a backend. E.g. Filebeat, Fluentd.
- Backend: It is responsible for storing the logs sent by the agent. E.g. Elasticsearch.
- Visualization: It reads logs from the backend and displays them in a human-friendly manner. E.g. Kibana.
Logging approaches
According to the use case and the preferences, one of the following approaches can be used to handle the logs with a third-party tool or custom solution.
- Using a node logging agent
 A node logging agent is a process that reads logs from a node and pushes them into a backend. Since each node contains some logs, the node logging agent is deployed on each node. For example- filebeat is a node logging agent which can be configured to push logs into elasticsearch i.e. the backend.
 - Streaming sidecar containerA streaming sidecar container can be configured to read logs from the other containers running in the pod. The sidecar can then output the logs into stdout/stderr from where Kubernetes will write them into a file. This approach is helpful in case some containers don’t write to a stdout/stderr by default.
- Sidecar container with a logging agentJust like the ‘Streaming’ sidecar container, this approach also involves a sidecar reading the logs of the other containers. However, in this approach, the ‘streaming’ sidecar itself is a logging agent and can push the logs into the backend on its own.
- Exposing logs directly from the applicationIn case you want to avoid the overhead of running a sidecar or a logging agent, you can configure your application’s code to send the logs to a backend on its own.
 A node logging agent is a process that reads logs from a node and pushes them into a backend. Since each node contains some logs, the node logging agent is deployed on each node. For example- filebeat is a node logging agent which can be configured to push logs into elasticsearch i.e. the backend.
 A streaming sidecar container can be configured to read logs from the other containers running in the pod. The sidecar can then output the logs into stdout/stderr from where Kubernetes will write them into a file. This approach is helpful in case some containers don’t write to a stdout/stderr by default.
 Just like the ‘Streaming’ sidecar container, this approach also involves a sidecar reading the logs of the other containers. However, in this approach, the ‘streaming’ sidecar itself is a logging agent and can push the logs into the backend on its own.
 In case you want to avoid the overhead of running a sidecar or a logging agent, you can configure your application’s code to send the logs to a backend on its own.
Logging cleanup
One important thing to make a note of is that Kubernetes Logging does not do anything for clearing up the past logs. It simply does not take responsibility for cleaning up the logs. Therefore, a script of the process has to be implemented to clear out the old logs so that space does not get filled up. For example, Docker runtime has a configuration file daemon.json to configure log rotation options.
Final words
That’s all. I hope this guide helped you understand the concepts about Kubernetes Logging Architecture. In our next articles we will continue to write more about the Kubernetes topics, please stay tuned for more learning & exploring!
Happy Learning!!
Explore more learning @ whizlabs.com/library
- NGINX Tutorial for Beginners (NEW) – Learn for FREE ! - February 21, 2022
- The Beginner’s Guide to Helm Charts - February 16, 2022
- The Complete Guide to Kubernetes Logging - January 14, 2022
- Explained: Kubernetes Architecture - January 12, 2022
- Top 15 Important Kubectl Imperative Commands in Kubernetes [CHEAT SHEET] - January 12, 2022
- What is Prometheus Grafana Stack ? - December 28, 2021
- How to prepare for the Certified Kubernetes Application Developer (CKAD) Exam? - December 6, 2021