

There is no doubt regarding the significance of data visualization for businesses all over the world. Business intelligence has moved beyond basic market research and evaluation of competitors. The modern precedents of business intelligence require the implementation of data visualization tools such as Tableau. The increasing demand for Tableau made us present this Tableau tutorial.
The demand for data visualization professionals in the existing IT labor market is one of the reasons for the increasing popularity of Tableau tutorial. Promising awareness of Tableau, its architecture, functions, and benefits present notable benefits for the career of IT professionals. Businesses need professionals to develop visualization tools that can help them monitor their operations and progress effectively.
Also Read: Top Data Visualization Tools
The following discussion gives you the perfect Tableau introduction with an outline of its product portfolio, architecture, and applications. Basically, the following discussion aims to provide a simple Tableau tutorial to get started with the best data visualization tool.
What is Tableau?
The foremost aspect of the introduction to any tutorial for Tableau is its definition. Tableau is a business intelligence and analytics platform for the purpose of visualizing data in flexible formats and understanding how the data can help a business. The main objective of designing Tableau was to provide a larger population of business users with reliable tools for engaging with data, deriving questions, and solving business issues.
Different types of businesses, including large global conglomerates and small food truck eateries, use Tableau to gain visible insights into their operations. You can find the features noted in any Tableau tutorial as the best reasons to validate its functionality and understand its benefits.
Important Features of Tableau
Tableau is capable of faster big data analysis due to the facility of different features that contribute to its functionality. The ease of obtaining data in the form of worksheets and dashboards with Tableau is primarily due to its features. Some of the best and notable features that you can find in a Tableau overview include data blending, a collaboration of data, and real-time analysis of data. In addition, you can also find the following features that make it easier even for non-technical users to use Tableau.
-
Simple Interface
The easy to use interface is one of the first things that you would note in a Tableau tutorial as the reason for its popularity. Users don’t need comprehensive technical skills or programming expertise for generating insights from data on Tableau. All you need to do is get the data you want to analyze and Tableau! Within no time, you can input the data into Tableau and derive effective visual insights that convey a meaningful story.
-
Drag and Drop Functionality
The drag and drop feature on Tableau helps users generate reports or stories without taking too much trouble. The visual query language, VizQL, helps in the translation of drag-and-drop actions into data queries, followed by the visual expression of data. VizQL simplifies the application of Tableau considerably through abstraction of the complexities involved in query and analysis processes.
Big Data Analytics is a revolution in the field of Information Technology. Let’s explore why Big Data Analytics is so much important in today’s world!
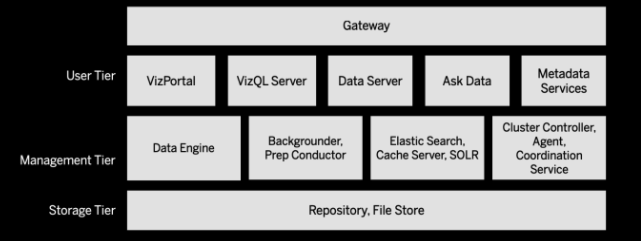
Architecture of Tableau
The next important addition in any tutorial for Tableau is its architecture. A detailed outline of the components in Tableau architecture can help you understand its features and applications effectively. The architecture of Tableau contains three components in general. The first component refers to data sources, while the second component refers to the Tableau Server, and the third component is the Tableau Desktop and the clients.
-
Data Sources
The data sources are the first notable element in Tableau architecture. The data sources help a user extract data from multiple data source options such as Oracle, MySQL, SAP, Salesforce, or an Excel file. Users could establish data connections with the sources either through a live data connection or extracting data from the source and storing a local copy of the data as a temporary database.
-
Tableau Server and Desktop
Before reflecting on the second component i.e., Tableau server in this Tableau tutorial, it is important to understand the Tableau Desktop. The Tableau Desktop is an authoring tool that helps users in creating visualizations, workbooks, and dashboards with the data from data sources.
The user’s request is very important for assigning the other components of the architecture. The Tableau Server includes many components that ensure the management of users and data security and other important functions. Tableau Server largely aims at the dynamic users on the web and mobile customers using the data on Tableau products.
-
Clients
The final additions in the architecture of Tableau refer to clients. Clients, in this case, refer to end-users who use Tableau, either through the web or mobile devices, on-cloud, on-premises or through a command-line interface for development. End-users generally interact with the Tableau Server to access visualizations and workbooks. Subsequently, the server components can work according to the request of clients and return the desirable outcome.
For a big data professional, it is required to know about open source big data tools. Check out the list of 10 Open Source Big Data Tools.
Use Cases for Tableau
The most important aspect for any Tableau tutorial refers to the application of Tableau in different use cases. Let us take a look at some use cases of Tableau to strengthen our understanding of the business intelligence tool.
-
Analyze Data Faster
You can use Tableau for faster analysis of visual data. Users could create and modify live reports, charts, and dashboards within minutes and ask questions of data available. Interactive visual displays, graphic encodings, side-by-side comparisons, and picture-perfect data displays make it easier for users to see and understand data at their disposal.
-
Explore Databases
Go through any Tableau tutorial, and you will find that it is a great tool to explore databases. The flexible interface of Tableau allows users to change the data they view and the way it is visualized. Users could explore large volumes of data with a generalized perspective and then dive into specific areas of their interest. Tableau makes navigating through databases a lot easier.
-
Play with Dashboards
Tableau helps you create dashboards for clear and direct communications. The expression of data in the form of bar and line charts, scatter plots, maps, or tables with Tableau makes it easier to build dashboards that can impress.
You can add common filters to all worksheets for analyzing available information effectively with multiple visual displays updating according to the filters. The analytical dashboards can help users in comparing information and tracking their performance. In addition, the facility of dynamic filters in the dashboards can help users dive deeper into visual data analysis.
-
Share the Knowledge
Users could also share their vital results from Tableau through Microsoft Office applications and by publishing them on Tableau Server. Furthermore, the facility of accessing graphs, reports, and dashboards on Tableau Server with credentials ensures security for your data. In addition, you should note in this Tableau tutorial that other users can save custom views, tag favorites, and make comments on results published on Tableau Server.
Also Read: Data Science vs Big Data vs Data Analytics
Are You Ready to Learn Tableau?
You can clearly note the different functionalities of Tableau after reading the above-mentioned discussion. The importance of visual data in business intelligence would continue to garner dominance, especially with the rapidly rising popularity of automation. In the near future, a Tableau developer can be the most significant asset for businesses. Therefore, a basic awareness of Tableau won’t be enough if you want to pursue a career with Tableau.
You have to invest considerable effort in understanding each addition in the product portfolio of Tableau. Most important of all, you need professional guidance for understanding Tableau, its benefits, applications, and its promises for your future career. If you want to learn more about Tableau, then enroll in the Tableau basics training course and start enhancing your data visualization skills. Don’t delay, there could not be a better time than right now!
- Top 45 Fresher Java Interview Questions - March 9, 2023
- 25 Free Practice Questions – GCP Certified Professional Cloud Architect - December 3, 2021
- 30 Free Questions – Google Cloud Certified Digital Leader Certification Exam - November 24, 2021
- 4 Types of Google Cloud Support Options for You - November 23, 2021
- APACHE STORM (2.2.0) – A Complete Guide - November 22, 2021
- Data Mining Vs Big Data – Find out the Best Differences - November 18, 2021
- Understanding MapReduce in Hadoop – Know how to get started - November 15, 2021
- What is Data Visualization? - October 22, 2021

thank you!