
If you find yourself bogged down by repetitive data transformation tasks and struggling to effectively manage and analyze your data, look no further than Power Query for a powerful solution.
With its user-friendly interface, Power Query empowers you to visually perform data transformations and save them for future use. This means you can work more efficiently, focusing on data analysis rather than data wrangling.
In this Power Query in Power bi beginner’s guide, we will cover the fundamentals of what Power Query is, how it operates, and the ways it can assist you in transforming and analyzing your data. By the end of this article, you’ll have a solid understanding of Power Query’s capabilities and how it can simplify your work.
Let’s begin our journey into the world of Power Query!
What is Power BI?
Microsoft Power BI serves as a powerful business intelligence (BI) platform, empowering non-technical business users to efficiently aggregate, analyze, visualize, and collaborate on data. Its user-friendly interface, reminiscent of Excel, makes it easily accessible to users, while its seamless integration with various Microsoft products enhances its versatility and self-service capabilities, demanding minimal initial training.
By delivering a universal, declarative paradigm that spans all the stages of database creation inside Visual Studio, Microsoft SQL Server Data Tools (SSDT) revolutionizes database development. The design features of SSDT Transact-SQL can be used to create, troubleshoot, maintain, and refactor databases. You can work directly with a connected database instance on- or off-premises, or you can work with a database project.
What is Power Query in Power BI?
Power Query in Power bi stands as a robust data connectivity and data preparation tool within the popular business intelligence platform, Power BI, crafted by Microsoft. This dynamic tool empowers users to effortlessly connect and import data from diverse sources, spanning Microsoft products like Excel, Power BI, Analysis Services, and Dataverse, among others.
With its prowess, Power Query in Power BI skillfully manipulates raw data, transforming it into a structured and refined format that perfectly suits the needs of analysis and visualization, making it an indispensable asset for data professionals and business analysts alike. You must add all data sources to Power BI’s new report option in order to generate a Power BI data model.
It simplifies the data import process by supporting various file types like Excel tables, CSV files, Database tables, Webpages, etc., and facilitates transforming data into the desired format for improved analysis.
The efficiency of Power Query lies in its ability to create reusable procedures, saving you from repeating the same steps with new data. By automating data transformation procedures, you can effortlessly reproduce consistent data outputs, making Power Query a valuable asset for streamlined and automated data handling. Power Query’s primary functionality is the ability to filter and mix, or mash-up, data from one or more of the many supported data sources. The Power Query M formula language is used to express any such data mashup.
Power Query in Power BI: Key Features
Power Query in Power bi offers an array of impressive features that enhance data handling and analysis activities:
- Broad Data Source Connectivity: With Power Query, you can effortlessly extract data from various sources, including text files, Excel Workbooks, CSV files, and more, providing flexibility and ease of data import.
- Simplified Table Combination: The Merge option in Power Query replaces Excel’s VLOOKUP function, enabling the seamless merging of tables, especially in handling large datasets with thousands of rows.
- Tables for Consistent Data Updates: Power Query proves valuable when dealing with periodic data updates. By automating the data replication process, it relieves the burden of manual updates, ensuring consistency in data imports.
- User-Friendly Functionality: You don’t need coding knowledge to utilize Power Query effectively. Its user-friendly interface allows you to perform tasks by simply clicking buttons and applying filters, just like working in Excel.
- Automated Process Tracking: Power Query not only simplifies tasks but also records your actions and thus achieving automated processes. This feature proves invaluable when dealing with recurring data preparation, saving significant time and effort.
Overall, Power Query emerges as a versatile tool, streamlining data operations, and elevating data analysis capabilities without the need for extensive technical expertise.
Also Read : Free Questions for Microsoft Power BI Data Analyst Exam (PL-300)
Power Query in Power BI: Quick Overview
1. Power Query in Power BI: Power Query Editor
Power Query Editor in Power BI can be accessed by navigating to the Home tab in Power BI Desktop and clicking on “Transform data.”
Initially, when there are no data connections, the Power Query Editor window appears blank, waiting to be filled with data.
As you load a query, the Power Query Editor window becomes more dynamic, displaying data information from the connected source. At this point:
- The ribbon features several active buttons for interacting with the data in the query.
- Queries are listed in the left pane, where they can be selected, viewed, and shaped.
- The center pane showcases the data from the selected query, ready for further refinement.
- The Query Settings pane provides details on the query’s properties and the applied transformation steps.
By exploring the ribbon, Queries pane, Data view, and Query Settings pane, you can effectively manipulate and optimize your data using Power Query Editor within Power BI.
2. Power Query in Power BI: Query Tab
In Power Query Editor within Power BI, the ribbon is organized into several tabs, including Home, Transform, Add Column, View, Tools, and Help.
Home tab hosts common query tasks, providing essential functionalities for data manipulation.
To initiate the query-building process, users can choose “New Source” from the Home tab, which displays a menu with frequently used data sources.
The Transform tab is a hub for popular data transformation activities, such as adding or removing columns, modifying data types, and dividing columns.
Additionally, many of the functions available on the ribbon can also be accessed conveniently by right-clicking on a column or other data in the central pane.
With these user-friendly tabs and features, Power Query Editor streamlines data handling and transformation, empowering users to shape and refine their data seamlessly within Power BI.
3. Power Query in Power BI: Inquiries Pane on the Left
In Power Query Editor, the left pane, also known as the Inquiries Pane, displays the list of ongoing queries along with their respective names. When you choose a specific query from this pane, the corresponding data is presented in the center pane, referred to as the Data Pane. Here, you can shape and transform the data according to your requirements.
4. Power Query in Power BI: Data Pane in the Center
Data Pane plays a crucial role in the Query view, enabling various operations. In the provided image, an established Web Data connection is depicted, and the Overall score column is selected. Right-clicking on the column header reveals a menu with available options, many of which mirror the buttons found in the ribbon tabs.
Upon selecting a right-click menu item (or a ribbon button), the query applies the corresponding step to the data, saving it as a query parameter. These steps are recorded in the Query Settings pane, capturing the sequence of actions taken in the data transformation process.
Through these intuitive panes and functionalities, Power Query Editor empowers users to efficiently manage data and streamline the transformation process in Power BI.
5. Power Query in Power BI: Query Settings Pane on the Right
The Query Settings Pane also referred to as the Right Pane, displays a comprehensive list of all the steps associated with a specific query. For instance, in the provided image, the Applied Steps section in the Query Settings Pane indicates that the data type of the “Overall score” column has been modified.
As additional shaping steps are applied to the query, they are documented in the Applied Steps section, providing a clear record of the data transformation process.
Importantly, it’s essential to understand that Power Query Editor doesn’t alter the fundamental data itself. Rather, it modifies and structures its representation of the data. The editor shapes and modifies how interactions with the underlying data occur, based on the transformed and updated perspective offered by Power Query Editor.
Within the Query Settings window, users have the flexibility to rename, delete, or reorder steps according to their preferences. Simply right-clicking on a step in the Applied Steps section reveals a menu with the relevant options.
It’s worth noting that all query steps are executed in the order they appear in the Applied Steps window.
With the versatility of the Query Settings Pane, users can seamlessly manage and fine-tune their data transformation process within Power Query Editor, ensuring a tailored and effective approach to data analysis in Power BI.
6. Power Query in Power BI: Advanced Editor
The Power Query Advanced Editor displays the code generated at each step, allowing users to view and even write their own shaping code.
To access the Advanced Editor, select “View” from the ribbon and then choose “Advanced Editor.” This opens a popup window displaying the current query code.
Within the Advanced Editor window, users can directly modify the code as needed. When done, they can select the “Done” or “Cancel” button to close the window.
7. Power Query in Power BI: Saving your Work
To save their work in Power Query Editor, users should choose “Close & Apply” from the File menu. This action saves the changes made and exits the editor. As progress is achieved, Power BI Desktop displays a status dialogue.
Once completed, Power BI Desktop allows users to save their work as a .pbix file by going to File > Save (or File > Save As).
Benefits of Power Query Power BI
Here are some key benefits of Power Query in Power BI:
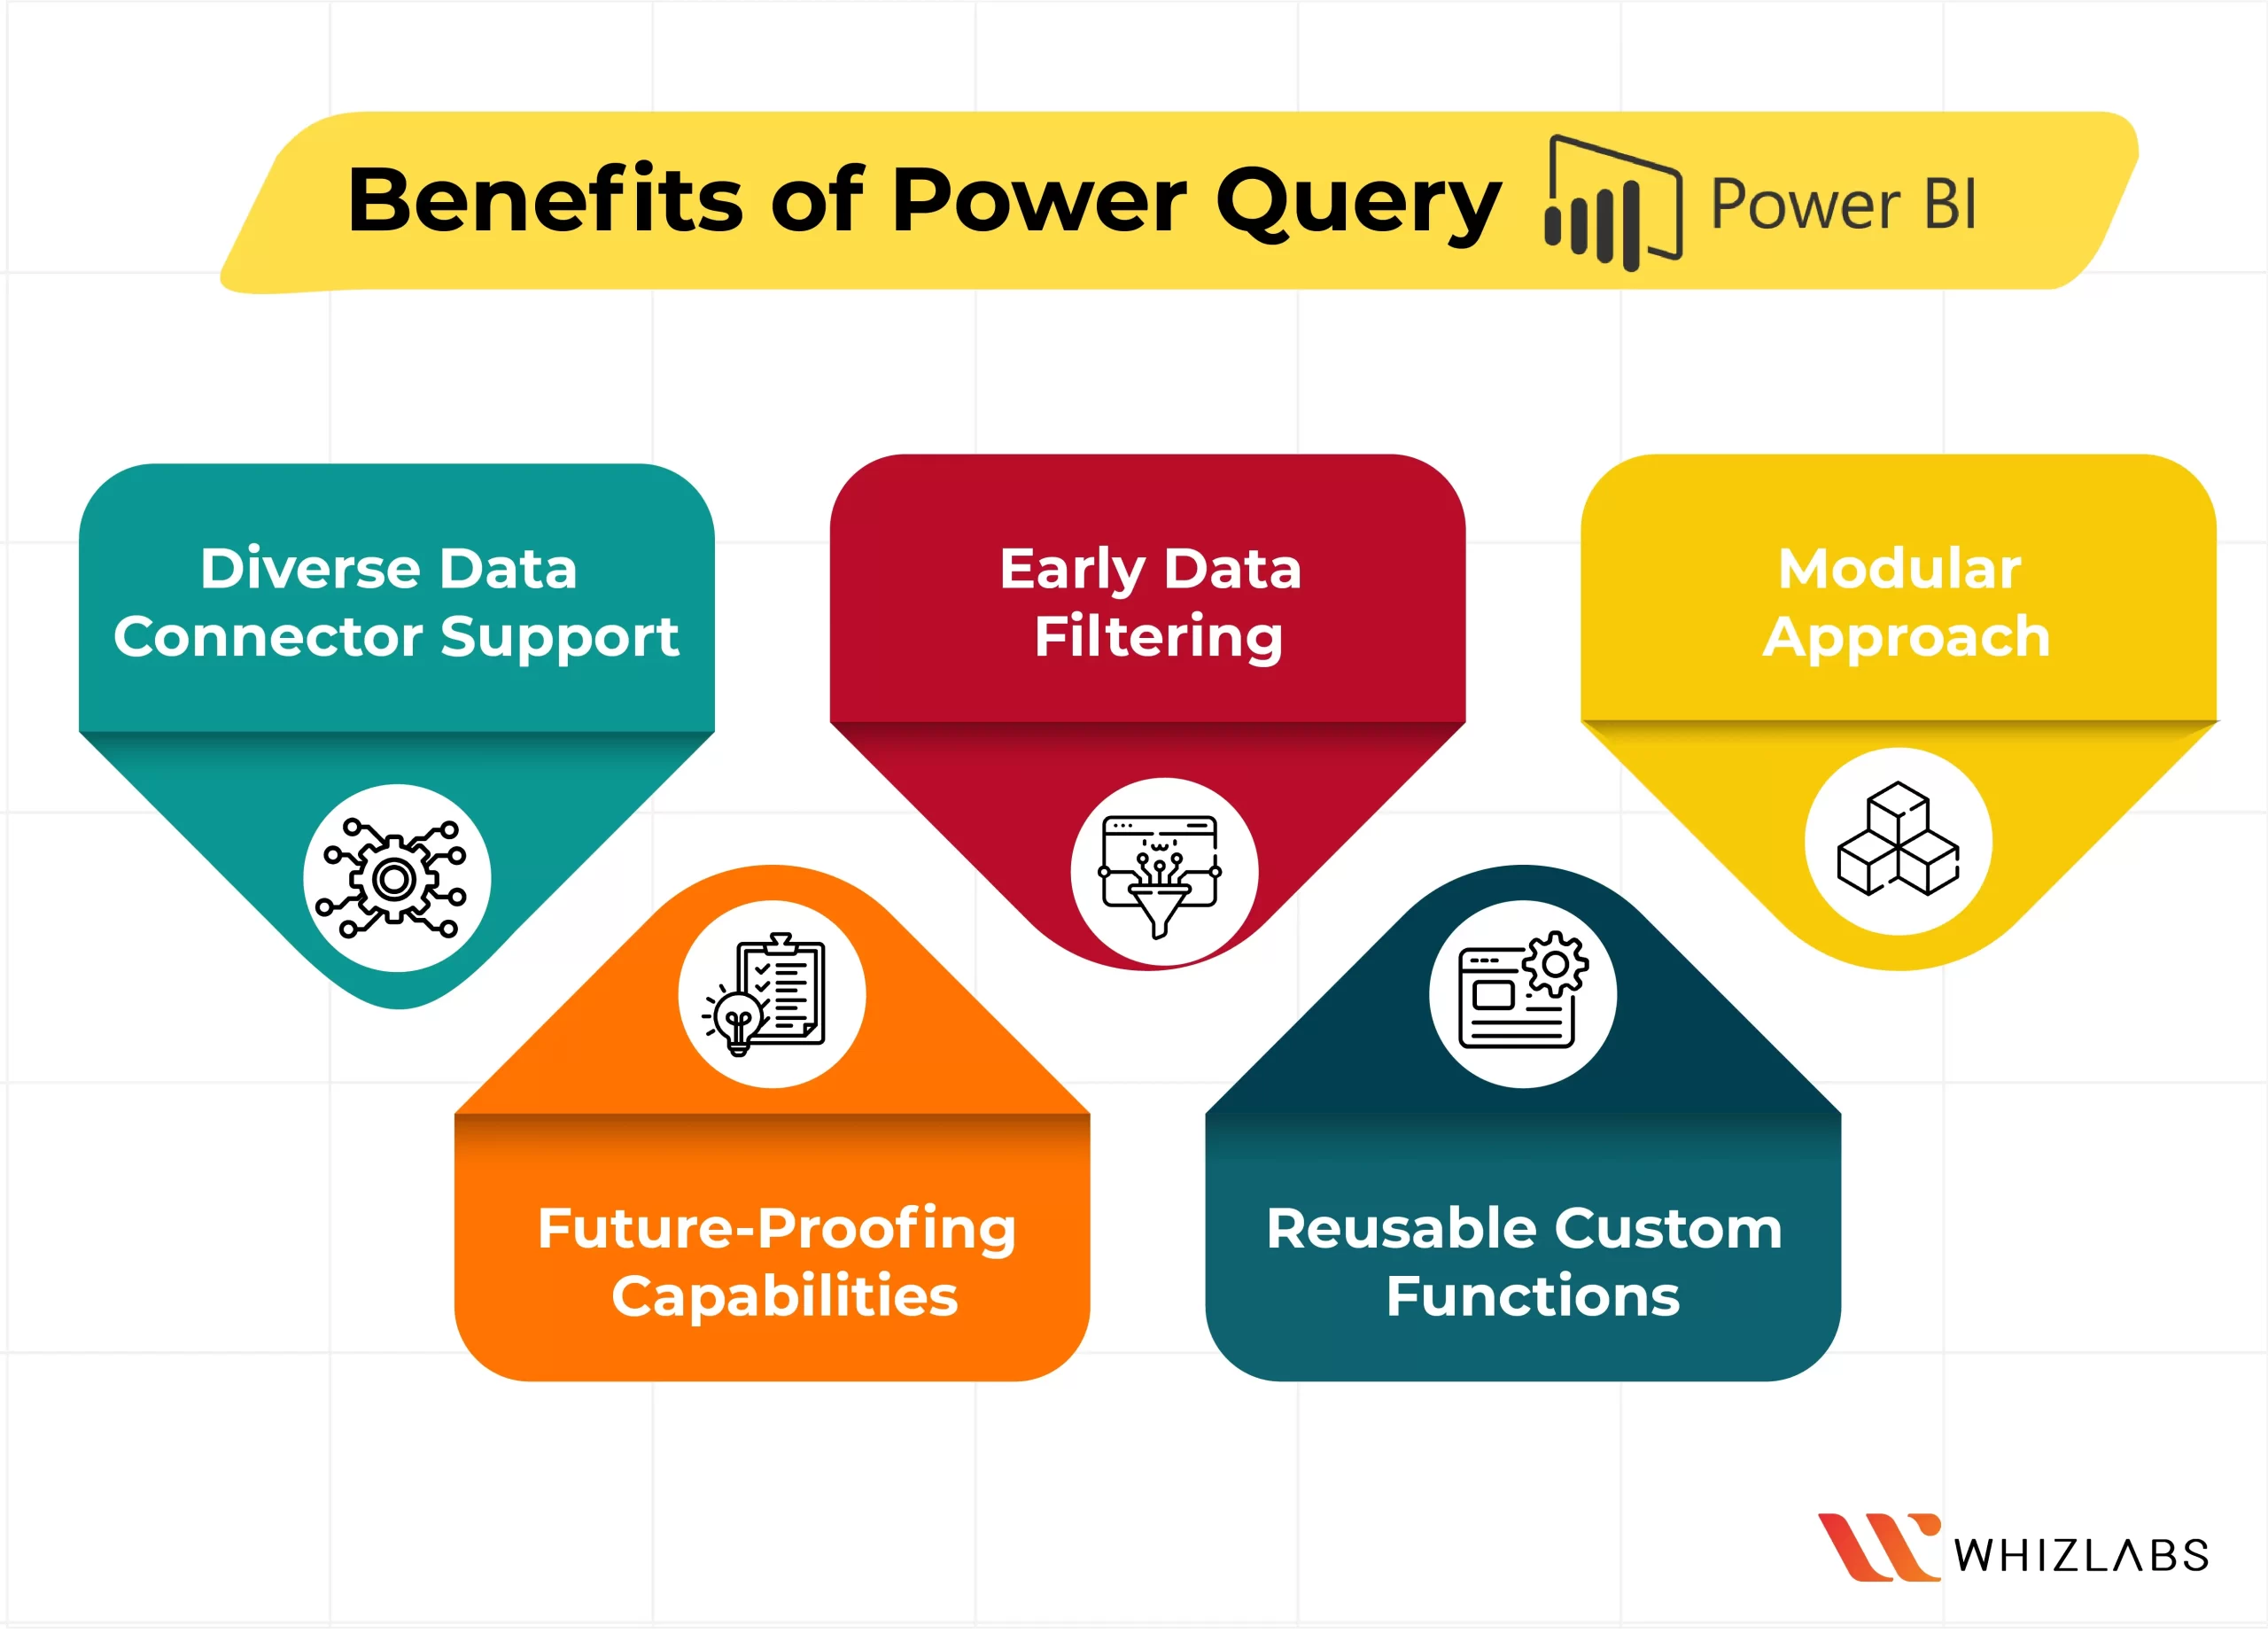
- Diverse Data Connector Support: Power Query offers a wide range of data interfaces, supporting various data sources such as TXT, CSV, Excel files, Microsoft SQL Server databases, and major SaaS services like Microsoft Dynamics 365 and Salesforce. This versatility ensures seamless integration with diverse data sets.
- Early Data Filtering: Adopting early filtering in the query process is highly beneficial. By removing irrelevant data, users can focus solely on the essential information during data preview, streamlining analysis and decision-making.
- Modular Approach: Power Query enables users to design a single query that encompasses all necessary transformations and calculations. However, for complex tasks with numerous steps, breaking the query into smaller, interconnected inquiries, each referencing the previous one, can enhance efficiency and organization.
- Future-Proofing Capabilities: Power Query equips queries with various capabilities to ensure resilience to changes in the data source. Even when some components of the data source change, the query can refresh and adapt, minimizing disruptions to data analysis processes.
- Reusable Custom Functions: Power Query facilitates the creation of custom functions that can be applied across different queries or values. Developing reusable functions streamlines data transformations and standardizes processes, leading to improved productivity and consistent results.
By harnessing these advantages, Power Query empowers users with a robust toolset to efficiently handle data, enabling insightful analysis and informed decision-making within Power BI. A set of tools called the Power Query SDK is intended to assist you in building Power Query connectors. These connectors are frequently referred to as Custom Connectors SDK.
Conclusion
Throughout this article, you have gained insights into Power Query’s functionalities, its compatibility with various databases, and the M language. Additionally, you’ve familiarized yourself with using Query Editor and Advanced Editor in Power BI Desktop, exploring data connections, and saving queries.
For a deeper understanding of Power BI and to further enhance your skills, consider taking hands-on labs and Power BI Sandbox in this power query in Power BI tutorial.
If you have any questions on this Power Query in Power BI blog post, feel free to contact us today!
- Study Guide DP-600 : Implementing Analytics Solutions Using Microsoft Fabric Certification Exam - June 14, 2024
- Top 15 Azure Data Factory Interview Questions & Answers - June 5, 2024
- Top Data Science Interview Questions and Answers (2024) - May 30, 2024
- What is a Kubernetes Cluster? - May 22, 2024
- What are the Roles and Responsibilities of an AWS Sysops Administrator? - March 28, 2024
- How to Create Azure Network Security Groups? - March 15, 2024
- What is the difference between Cloud Dataproc and Cloud Dataflow? - March 13, 2024
- What are the benefits of having an AWS SysOps Administrator certification? - March 1, 2024