Power BI Desktop is an impressive business intelligence tool with a wide range of reporting capabilities. However, it lacks the ability to create paginated reports, which are intended for exporting or printing.
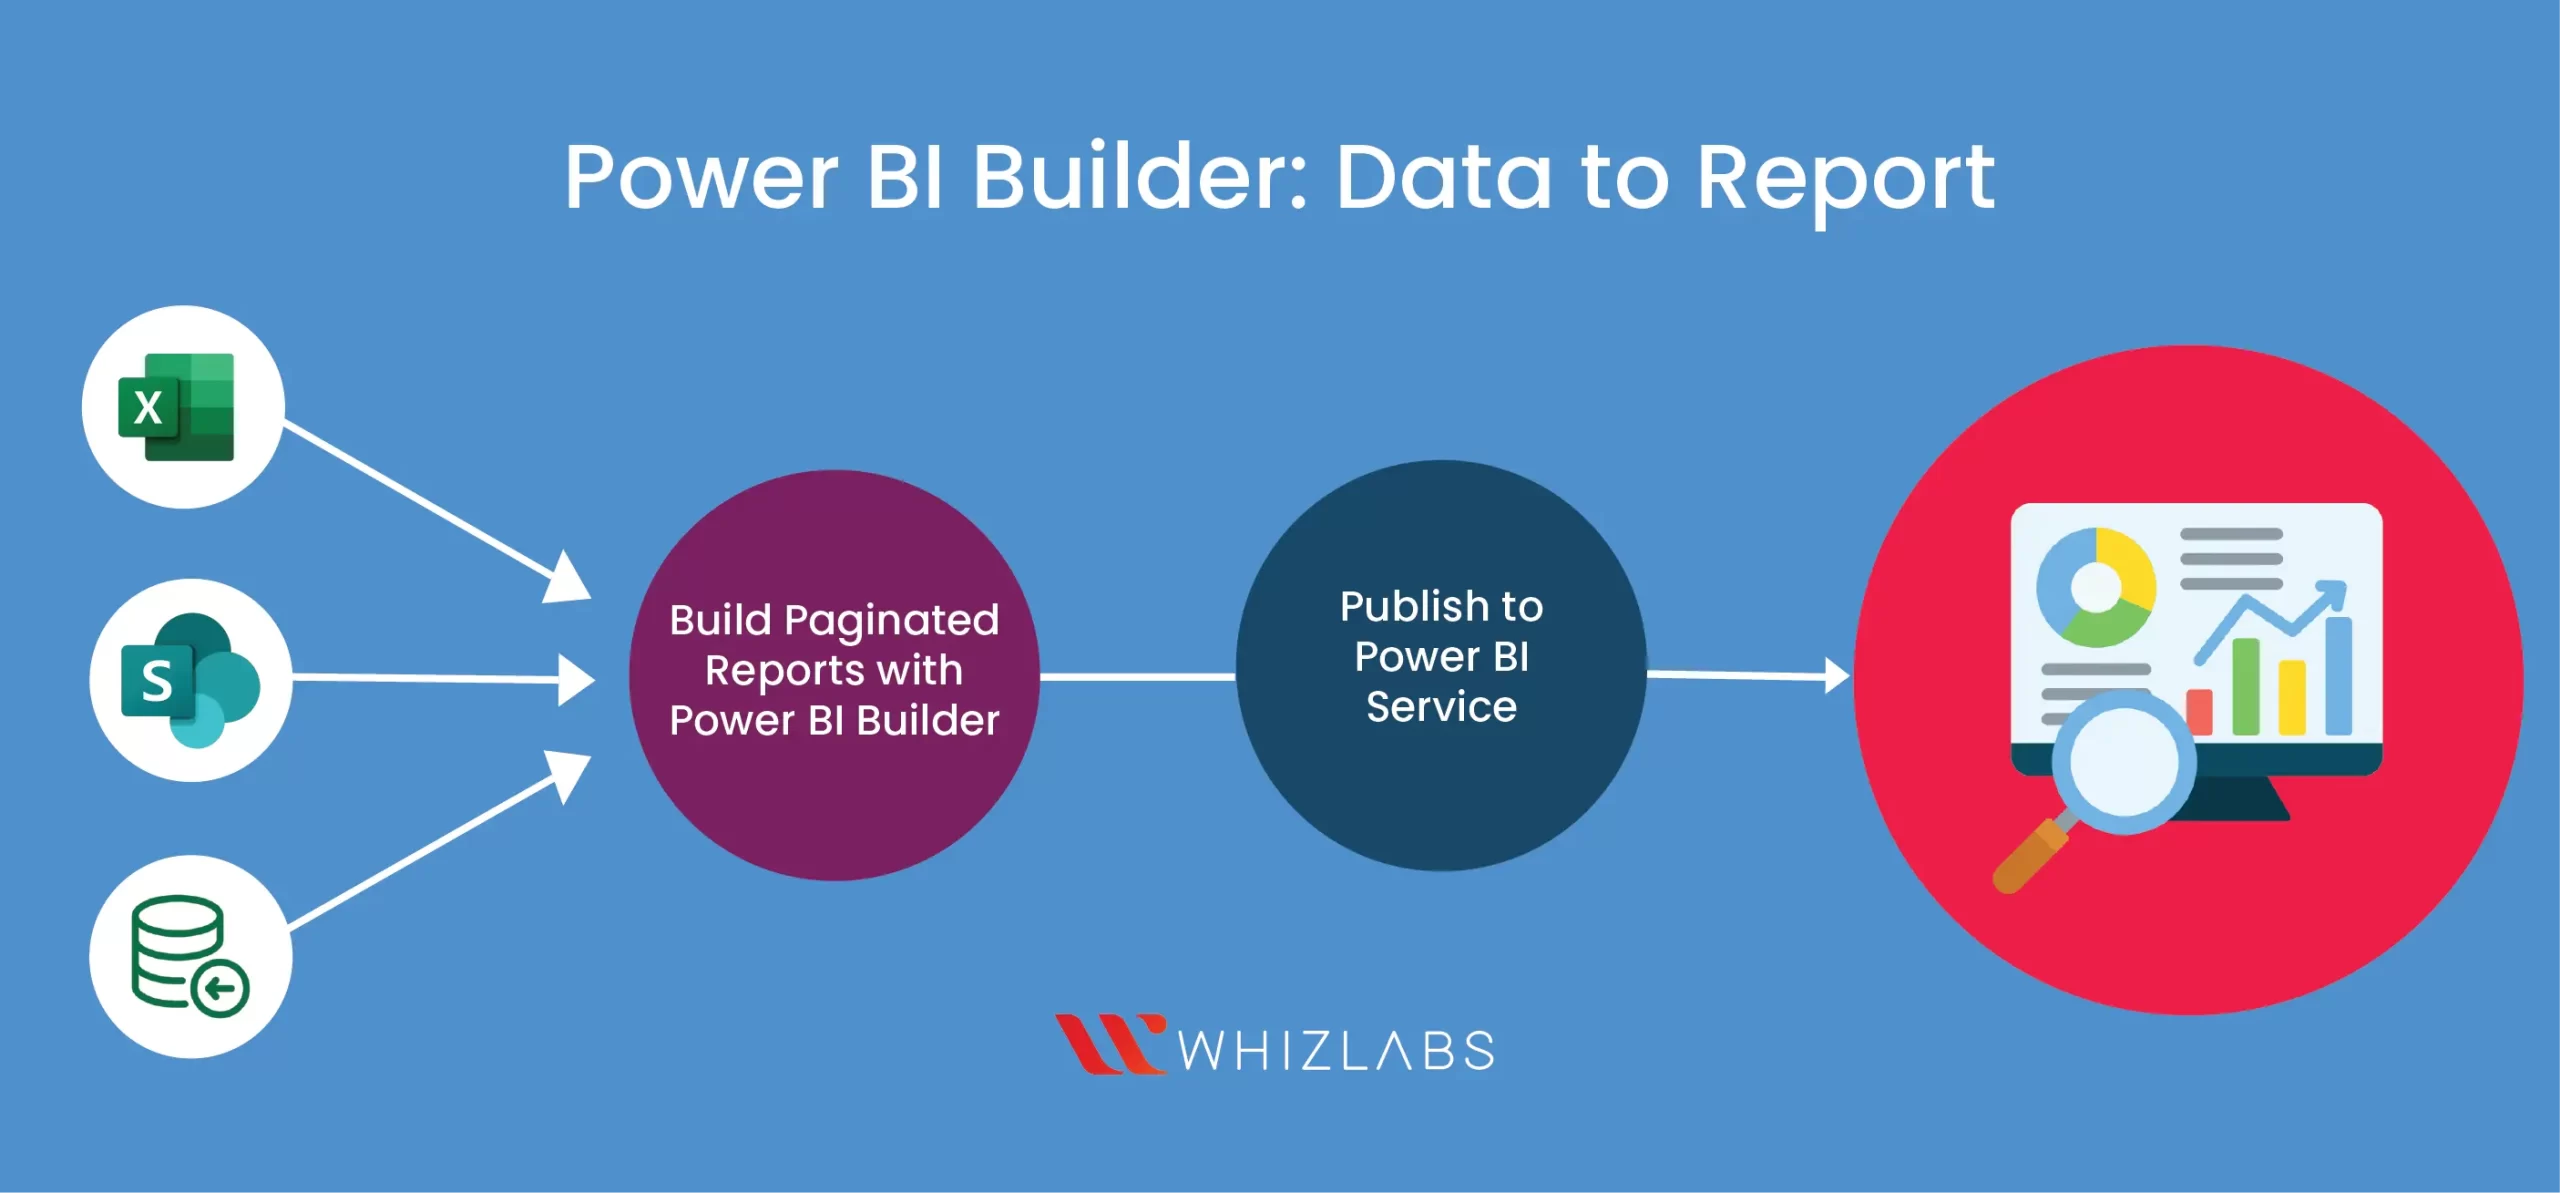
To overcome these limitations, Microsoft introduced Microsoft Power BI Report Builder. With this tool, users can easily design and create paginated reports, which can then be shared via the Power BI service.
In this blog post, we’ll introduce you to Power BI Report Builder, delving into its purpose, features, and options. We’ll also explore its advantages and limitations to provide a comprehensive overview of this valuable reporting tool.
Let’s dig in!
What are paginated reports in Power BI?
Before knowing what is Power BI Report builder, it is essential to understand the term paginated report. It is table based report that is designed mainly to get fit on the page as per the format defined by the developer.
Paginated reports are specifically crafted for printing or sharing purposes. Their name “paginated” arises from their format, optimized to fit on a single page. These reports present all the data in a table format to accommodate multi-page tables when necessary. With precise control over the report page layout, it is possible to fine-tune the presentation.
What is meant by Power BI Report Builder?
Power BI Report Builder serves as the standalone tool to author paginated reports for the Power BI service. Its capabilities empower users to create professional and printable reports that cater to various business needs.
Power BI paginated reports in the Microsoft Power BI platform.
In the absence of this tool, Creating paginated reports in Power BI cannot be done in the Power BI ecosystem. The accepted file format type in the Report builder is .rdl.
Power BI Report Builder is a free tool that you can easily install and use on your local machine. With just a Microsoft account, you can publish paginated reports to My Workspace, your personal workspace. However, to publish paginated reports to workspaces other than your own, you’ll need a Power BI Pro or Premium Per User (PPU) license.
Also Read : The Value of Power BI Certification in 2024: Is it Still Worth Pursuing?
What are the key Power BI Report Builder features?
Some of the prominent features of the Power BI Report Builder such as:
- RDL Reports: RDL (Report Definition Language) reports are made using the Power BI Service.
- Workspace Integration: Seamlessly open and save reports from workspaces, streamlining the report management process.
- Advanced Dataset Querying: Supports querying both Power BI advanced datasets and datasets of non-advanced users, ensuring broad compatibility.
- Table Query with DAX: Utilize Power BI queries to explore table construction using Data Analysis Expressions (DAX).
- User-Friendly: Requires only a basic level of Power BI and DAX knowledge, making it accessible and user-friendly for all.
System Requirements for Power BI Report Builder
For the installation of the Power BI Builder, the below-shown specifications are required:
| Requirement | Minimum Specifications |
| Operating System | Windows 7 or later |
| Processor | 1.4 GHz or faster |
| Memory | 4 GB |
| Storage | 2 GB of available disk space |
| .NET Framework | 4.5 or later |
How to download Power BI Builder?
To publish paginated reports to workspaces other than your own, it’s essential to have a Power BI Pro or Premium Per User (PPU) license.
Follow these steps to get started:
- Access your “My Workspace” and log in to your existing account or create one if you don’t have it yet.
- On the left side of the page, choose “Workspaces,” then select “My Workspace.”
- Visit the Power BI website.
- Click on the “Download” button and choose “Power BI Report Builder.”
To download Power BI Report Builder, use the provided link.
Getting Started With Power BI Report Builder
1. Opening a new file
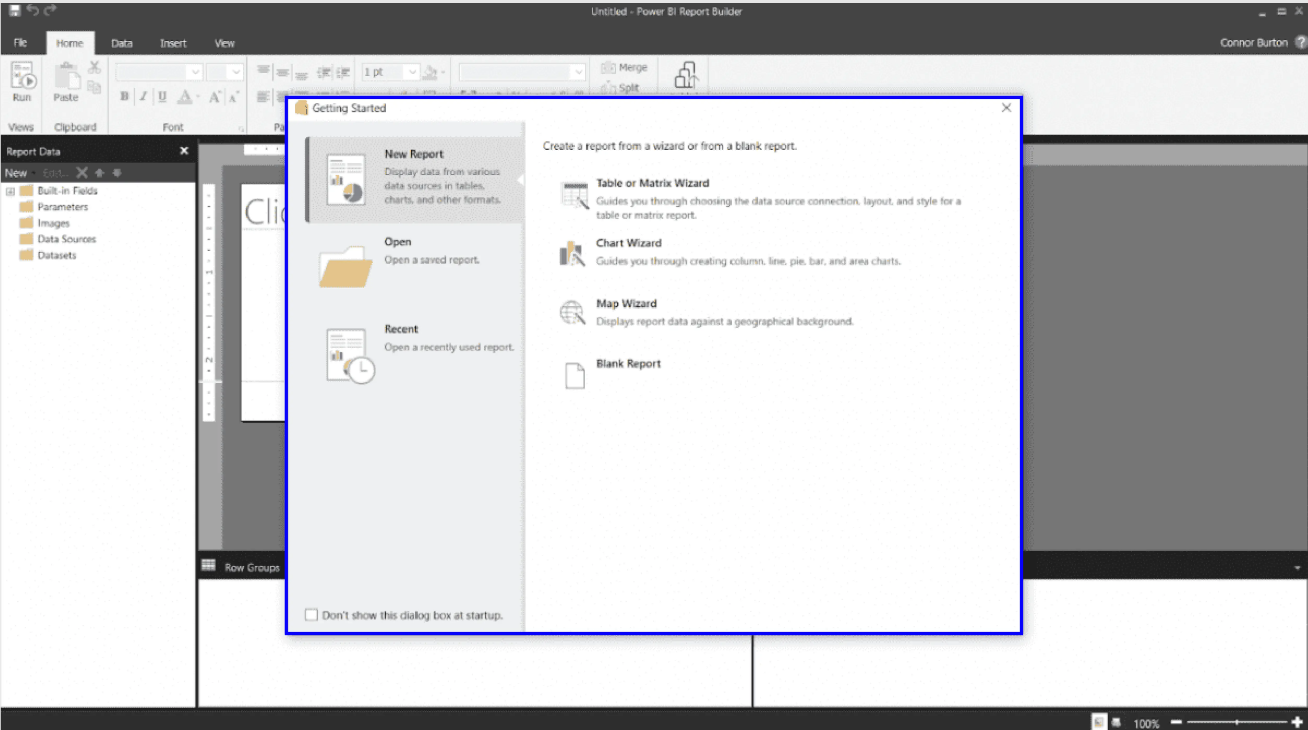
After installing the Power BI Report Builder for the first time, you’ll encounter the welcoming screen. Here, you have the option to either open an existing report or begin a new one.
The highlighted area represents the design surface, which serves as the foundation for your paginated report. It acts as the report’s template, and the actual data won’t appear until the report is run.
For instance, the placeholder “[&ExecutionTime]” will be replaced with the date and time of report execution.
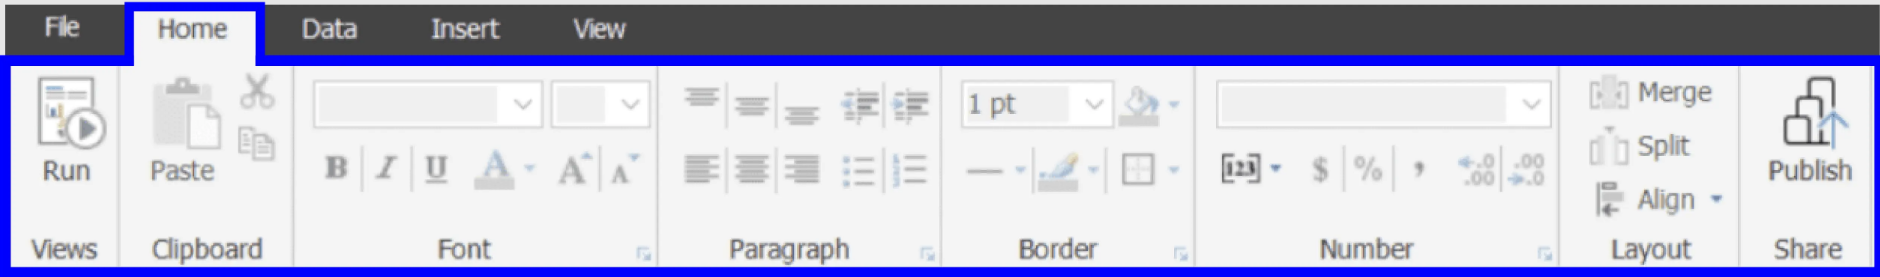
2. Home Tab

Above the design surface, you’ll find the toolbar, providing different tabs to modify the report’s formatting and setup. To the left of the design surface lies the Report Data pane, where you can access all built-in fields, parameters, images, data sources, and datasets included in your report.
Below the design surface, you can view any defined Row Groups or Column Groups for the report. These groups function like hierarchies, with one field acting as the parent of another.
For example, in a product list, each product may belong to a specific category, where the category serves as the parent and the product as the child in the group/hierarchy.
3. Report Data Pane
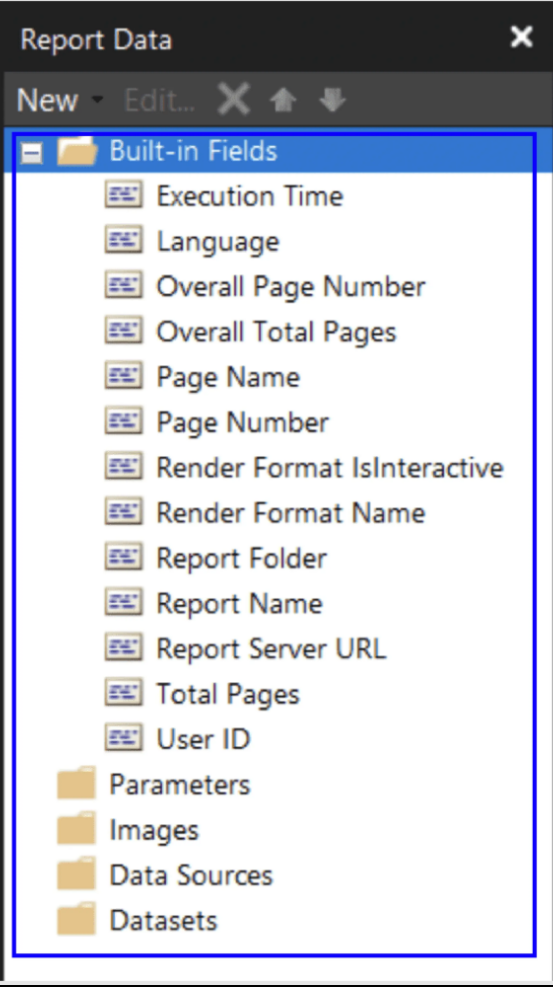
Let’s examine the Report Data window in more detail. The built-in fields are incredibly helpful for formatting and exporting purposes and are accessible for each report opened in Report Builder. While the other folders may currently be empty due to the absence of data in the report, they will be populated once datasets are added.
4. Run Option
The Home tab serves multiple purposes. Firstly, it is where you can run your report by clicking the “Run” button, populating the report template with data from your dataset(s). Additionally, the Home tab provides numerous formatting options. Lastly, this tab facilitates publishing your paginated report to the Power BI service.
Even if no datasets exist in the file, clicking the “Run” button will still execute the report and display the date and time of the report execution.
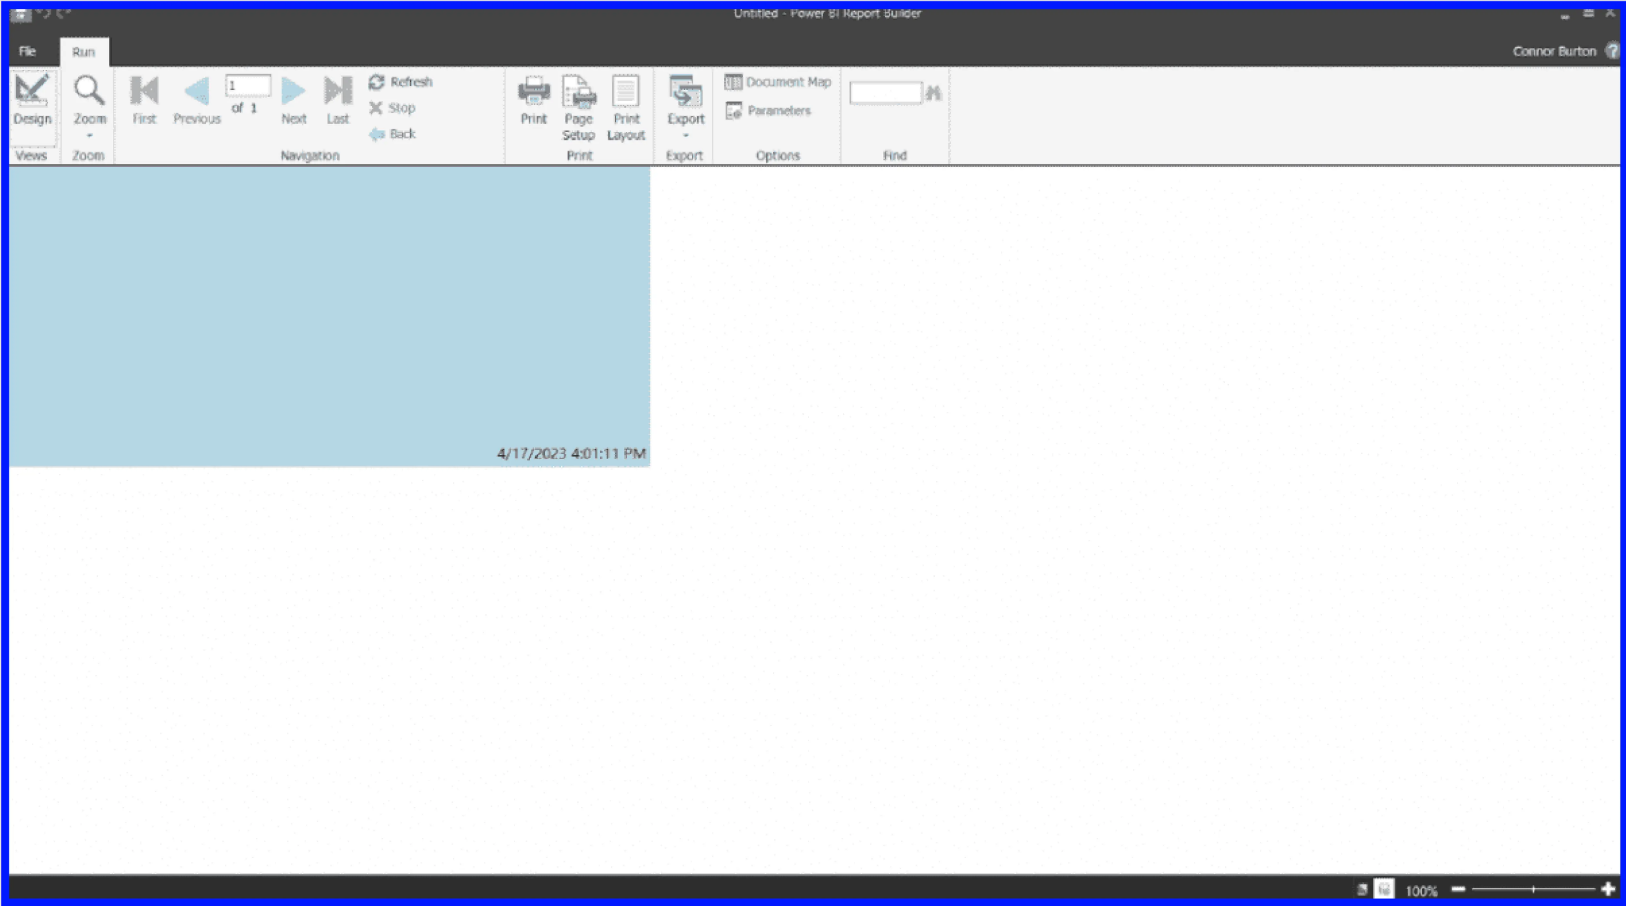
5. Export Option
When you run the report, it will appear as shown in the image below. To provide clarity on the design surface’s size, I changed the background to light blue.
The toolbar offers various functionalities, such as zooming in and out, navigating through multiple pages (common in paginated reports), refreshing the report, editing the page setup and print layout, and exporting the report from Report Builder in formats like PDF, Excel, CSV, and more. To return to the Design mode, simply click the Design button in the toolbar.
6. Tabs
In Power BI Report Builder, you’ll discover essential functionalities in the respective tabs:
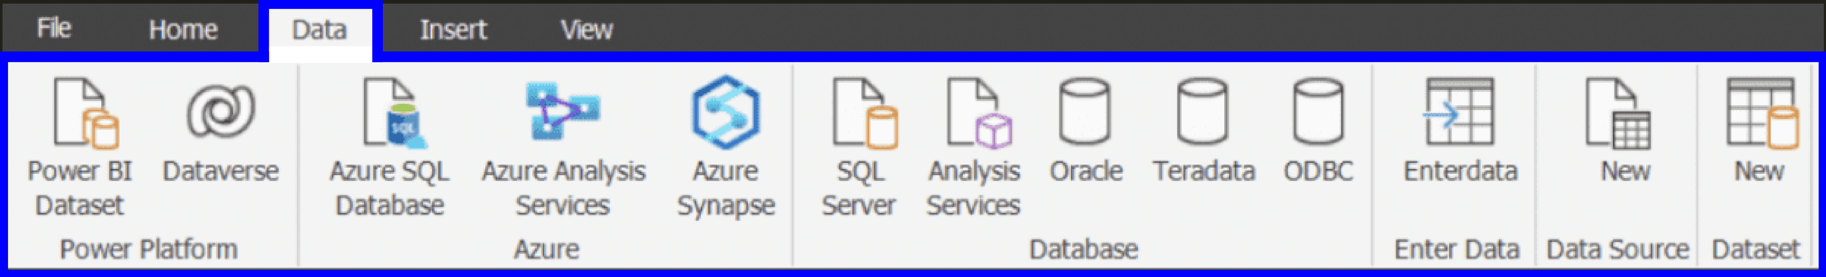
- Power BI Report Builder data tab: You can access all available data connections. And also you can manage and work with your datasets.
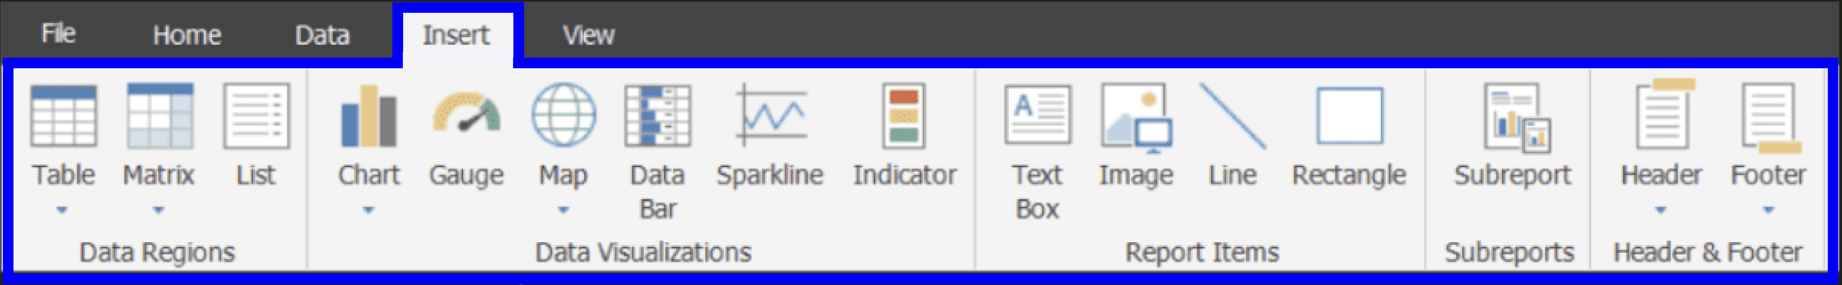
- Power BI Report Builder insert tab: You can find a wide array of visualization options to enhance your reports. This tab offers various tools to create meaningful and insightful visual elements.

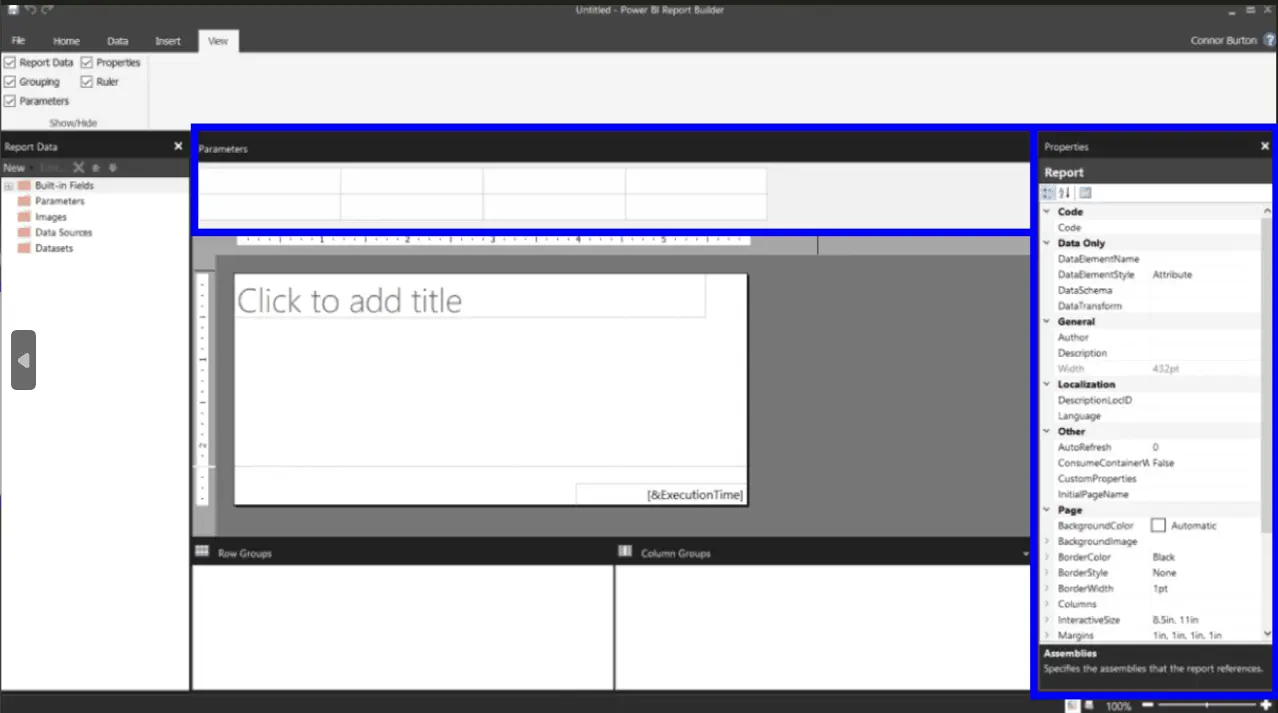
- Power BI Report Builder view tab: Customize the appearance of your Power BI Report Builder instance. You can show or hide different panes around your design surface to optimize your working environment.
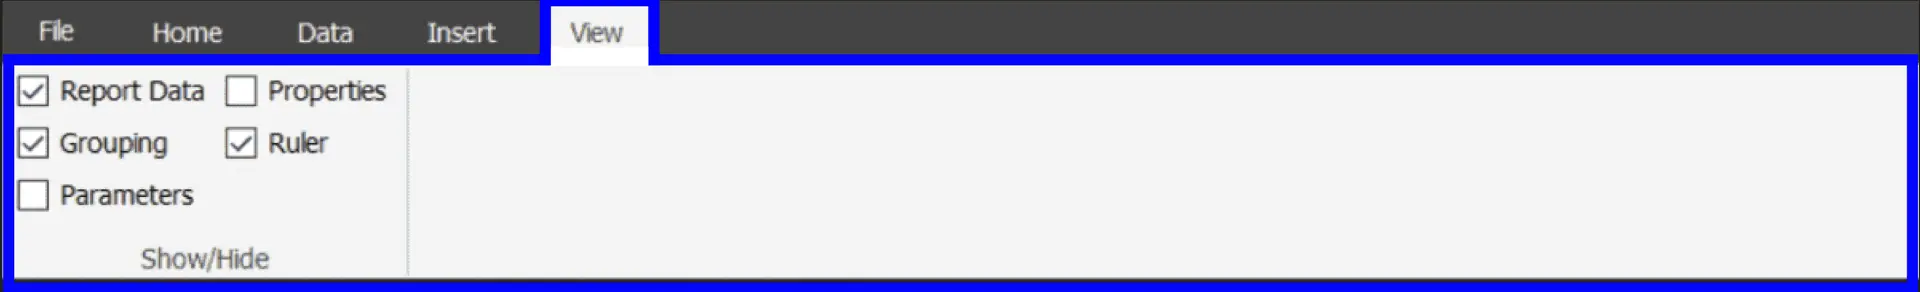
After checking specific boxes in the View tab, you can toggle the visibility of various panes. For instance, the image below displays the canvas with all boxes checked, revealing the parameters and properties panes.
By default, these panes are unchecked, but enabling them provides additional functionality and information to streamline report creation and management.
Know More : What is Power Bi?
Power BI Report Builder – Limitations
Power BI Report Builder does have some limitations to be aware of:
- Limited Documentation and Resources: While the documentation and resources have been improving since the beginning of 2024, it may still be challenging to find comprehensive support materials.
- Limited Native Data Source Connections: The tool offers only a limited number of native data source connections, which may restrict data integration options.
- Data Gateways for On-Premises Data: To connect with on-premises data sources, users need to set up data gateways, adding an extra step to the data integration process.
- Publishing Restrictions: Users can only publish paginated reports to their own workspace (My Workspace) without a Power BI Pro or Premium Per User license, limiting collaboration options.
- Complexity with Non-Native Data Sources: Working with report parameters becomes more intricate when using non-native data source connections, potentially affecting report design and functionality.
Despite these limitations, Power BI Report Builder remains a valuable tool for creating paginated reports in Power BI Service. Understanding its constraints helps users make informed decisions and find workarounds when necessary.
FAQs
Is Power BI report Builder free?
Yes, Power BI Report Builder is available for free, and you can download it from the Microsoft Download Center without the need for a license. With this free tool, you can create and design paginated reports.
How to install Power BI Report Builder?
To install Power BI Report Builder, follow the below steps:
- Visit the Power BI website.
- Click on the “Download” button and choose “Power BI Report Builder.”
How does Power BI Report Builder work?
Report Builder by Microsoft serves as a powerful tool for creating paginated reports for SQL Server Reporting Services and Power BI Report Server. Its functionality revolves around specifying data retrieval, defining data sources, and determining the presentation format. With Report Builder, users can effortlessly craft and design reports tailored to their needs and preferences.
Conclusion
Hope this guide offered a quick demonstration of Power BI Report Builder and its features.
When aiming for a pixel-perfect and professionally designed report, Report Builder is the ideal choice. Its built-in features simplify the process of creating a polished and visually appealing report with ease.
If you want to explore more features on the Power BI platform, try our hands-on labs and sandboxes.
If you have any questions about this blog post, feel free to comment to us!
- 7 Pro Tips for Managing and Reducing Datadog Costs - June 24, 2024
- What is Azure Data Factory? - June 5, 2024
- An Introduction to Databricks Apache Spark - May 24, 2024
- What is Microsoft Fabric? - May 16, 2024
- Which Kubernetes Certification is Right for You? - April 10, 2024
- Top 5 Topics to Prepare for the CKA Certification Exam - April 8, 2024
- 7 Databricks Certifications: Which One Should I Choose? - April 8, 2024
- What are the benefits of having a Google Cloud Database Engineer Certification? - March 18, 2024