
Data Modeling stands as one of the foundational pillars in Power BI report development, serving as the backbone for the design and intent of each report. Leveling up your expertise in data modeling will impact the Power BI reports, enriching their comprehensibility and the value of the insights they provide.
In this blog, you will learn data modeling in Power BI, how to optimize the Power BI model, the basics of data modeling in Power BI, and Power BI Data modeling best practices.
If you want to get into the Power BI world, taking the Microsoft Power BI certification can nurture you with some basic knowledge of Power BI data modeling, data modeling concepts, and so on.
Let’s dive in to learn more!
What is Data Modeling in Power BI?
Data modeling in Power BI in Business Intelligence helps to connect the varied data sources in the Power BI tools with the usage of relationships. A relationship can help to define how the data sources get connected and it is possible to create data visualization on the varied data sources.
With the help of modeling features, the calculations can be customized by the existing tables and columns can be created directly within the data visualization in Power BI. It can make the organization define whatever metrics they require and help to carry out the calculations for the desired metrics.
Whenever you talk about the data modeling concept, you have come across the term star schema. This approach is mainly implied for data warehousing and relational databases and it is a recommended method in Power BI.
The two major benefits of the star schema approach such as:
- Usability: It can help to make the data model cleaner and highly organized and the report generated is easy to use.
- Performance: Migrating to the star schema approach can allow you to scale up the report into a massive amount of data. DAX measures also help to calculate efficiently.
Understanding the basic concepts of data modeling in Power BI will help you to fetch the right results in the analysis report. It can help to save time in finding the various errors that might evolve from inappropriate relationships. To better understand the concept of data modeling in Power BI in detail, continue your reading.
In data-related PL-300 certification, data modeling is often a core component. Understanding data modeling concepts and techniques is vital for professionals who work with data in roles such as data analysts, database administrators, and business intelligence specialists.
Also Read : Free PL-300 Exam Questions
How to Optimize the Power BI Model?
The significant factor to consider while optimizing the Power BI model is following effective data modeling practices. In common, the good data model can allow Power BI reports to get scaled up into data rows in millions and billions of values but still the performance will be maintained as before.
Here are certain things to consider when optimizing the Power BI Model, followed by data modeling practices:
Time intelligence turned off: A feature in Power BI creates a date or time hierarchy automatically whenever the data field gets added up into a visual. Each time, one of those hierarchies will be created. At that time, the additional table will be appended to the data model. Just imagine, this can impact the Power BI report, slow down visual rendering, and increase the refreshing duration. So, it is better to turn off this feature and go for a dedicated date table for all the date or time-based hierarchies.
Only loading the required columns: With the usage of the power query editor, any columns in the report can be removed if it is not required. One of the common fields that can be retained if it is required such as the Row ID Field. This field is unique for each dataset, for example, the Order ID used for each transaction in the orders table.
This ID field is also retained in the form of text which further weakens the strength of the model. If the ID is not explicitly employed in a relationship, it’s unnecessary to load it into the model.
Only loaded rows are required: Importing all of the business data into the Power BI report is a complex task. The one thing we can do is, we can talk to the business users and ask them how much data is required. If they want to see the older data, then you can only able t import a summarized version of the table rather than producing reports for every single transaction.
Data Modeling in Power BI: Basics
To create data modeling in Power BI, it is essential to add all the data sources in the report option available in Power BI. To append a data source, we have to go to the Get Data Option.
Then, select the required data sources that you want to connect and press the connect button. If the data source gets added, then it will be shown on the right sidebar. Here, we have used 2 xls for importing data such as customer and product. In Power BI, the interface can be organized into three tabs such as report, data, and relationship.
In the report tab, we can create and view the data visualizations, charts, and dashboards. The chart type that you want to display the data also can be chosen. Some of the chart types available in the Power BI such as bar charts, pie charts, or tables.
In the data tab, the data accessing and manipulation of the imported raw data from the data sources will be carried out. It shows the data that are defined in the relationships between the data and sources.
In the relationships tab, we can be able to see the connections that are made between the varied data sources. The power BI can automatically detect those connections based on the common columns. You can be able to create relationships between the columns with the availability of the options such as Creating relationships in Power BI.
In this tab, you can be able to create a visual representation of the data in the form of charts, and tables and make it highly conveyable and actionable. In the data tab, you can be able to work directly with the existing data, and in the relationship tab, the connection management between the varied datasets will occur.
In addition, you can be able to add and delete the relationships in this tab by just right-clicking and choosing the delete option. It can be able to remove the relationships by dragging and dropping the fields to create any new connections between the data sources.
You can also use the Relationship view to hide specific columns in the report view. Simply right-click on the column name and select the “Hide in report view” option.
One of the powerful features of Power BI is the ability to create calculated columns and tables:
Creating Calculated Columns in Power BI
- Calculated columns are derived from existing data, and you can apply calculations or combine elements from different columns to create new metrics or relationships between tables.
Creating Calculated Tables in Power BI
- Calculated tables are entirely new tables you create using Data Analysis Expressions (DAX). These tables are based on calculations and can be used to build relationships between other tables or perform more complex data manipulations.
To create calculated columns or tables, you can navigate to the Data View tab on the left side and click on Modeling. In the Modeling tab, you can find options to create new columns or tables. You’ll use the DAX language to define calculations or transformations.
For instance, you can create a calculated column that extracts the last three characters from a product ID, as shown in the example provided. Once you’ve created calculated columns or tables, you can use them in your report visualizations to gain deeper insights into your data.
Furthermore, Power BI allows you to manage time-based data effectively. When working with date fields, you can enable drill-through functionality, allowing you to dive into your time-based data hierarchy. For example, you can start with years, drill down into quarters, and further into months. This feature is useful for analyzing time-series data and exploring trends over time. To get a better understanding of Power BI, you can take Exam PL-300: Microsoft Power BI Data Analyst.
Data Modeling Best Practices
Here are some data modeling best practices for you to carry data modeling process efficiently:
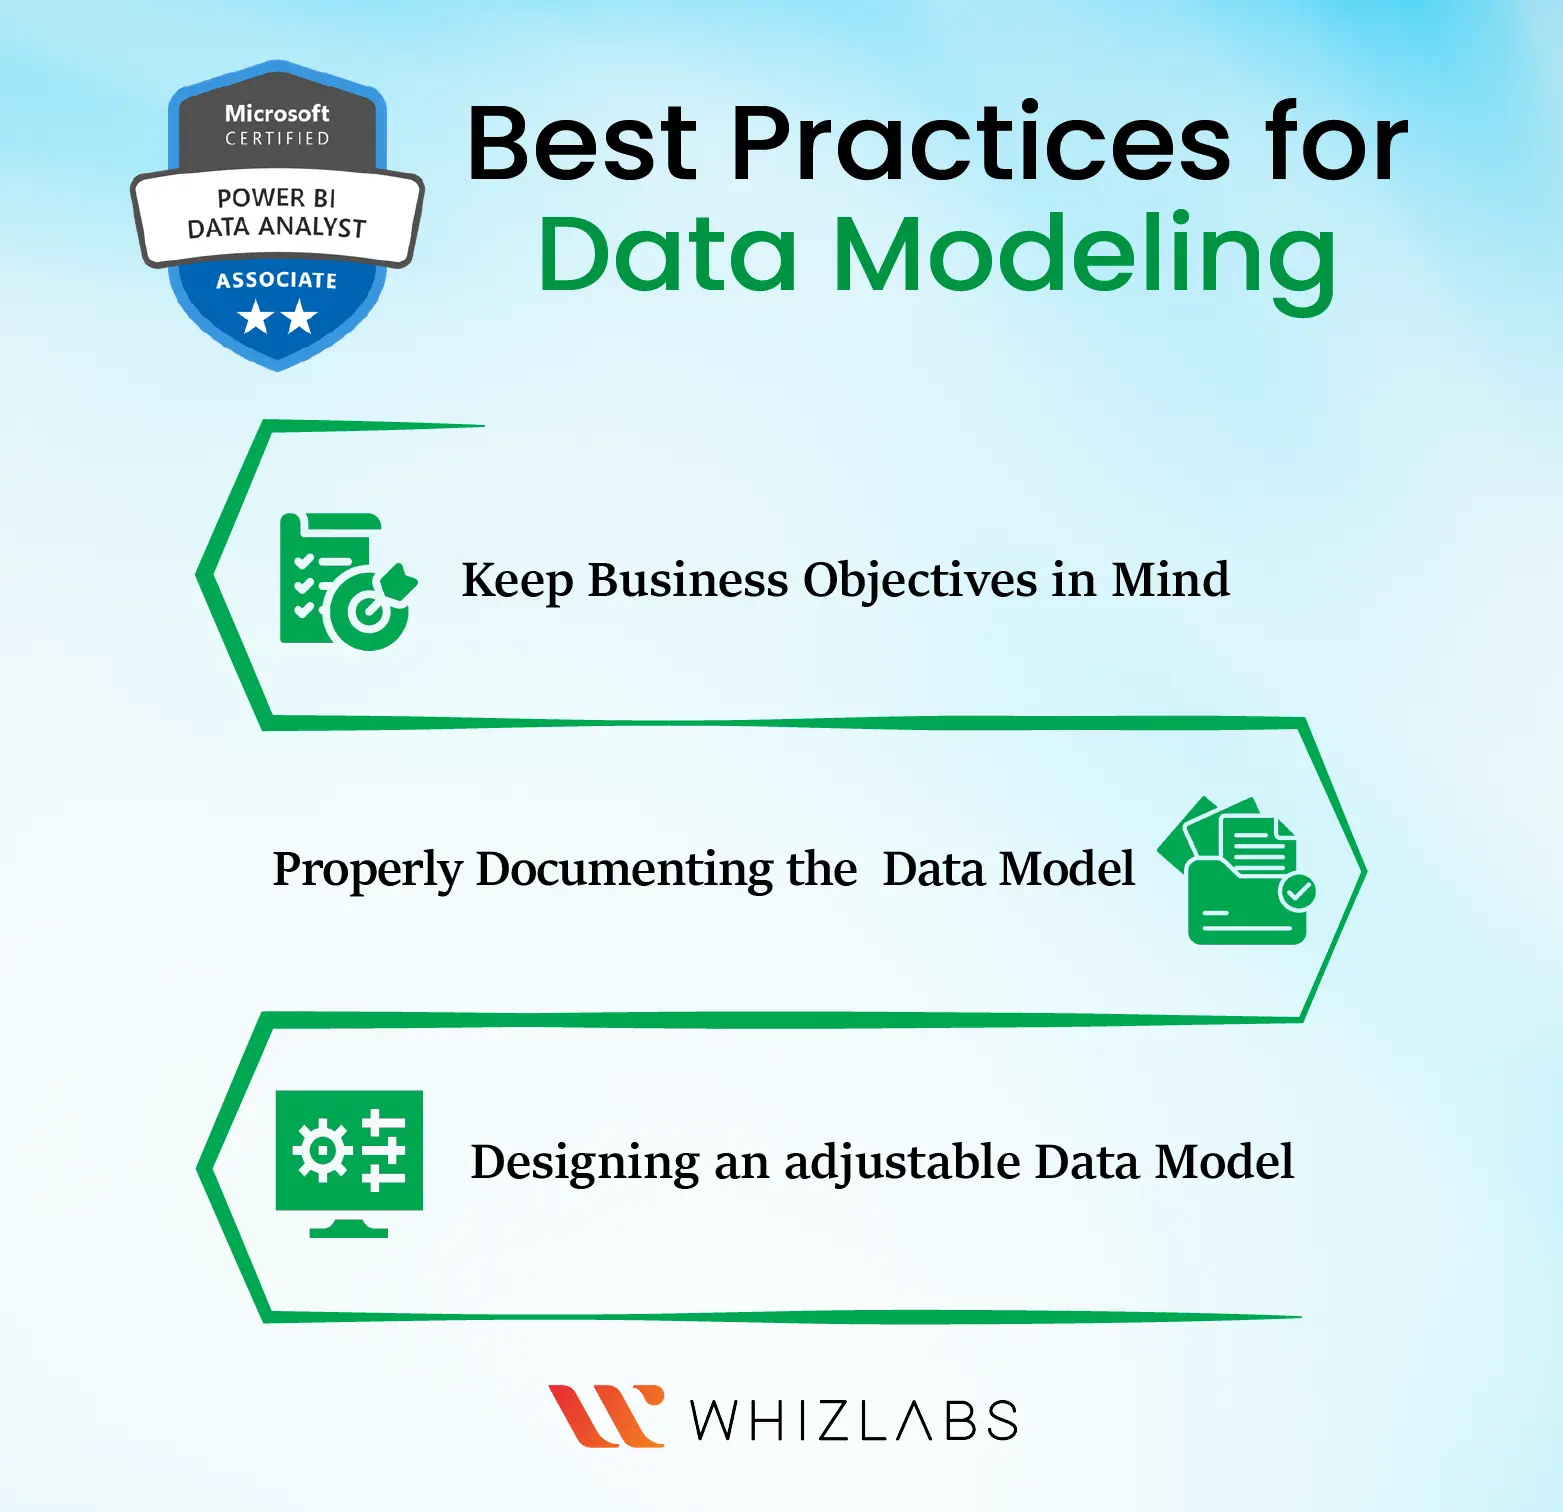
Keep Business Objectives in Mind
One of the basic things you have to keep in mind while data modeling is whether it aligns with the business. As software engineers, we just forget the main objective, so you have to ensure that you get advice from the business analysts to ensure that the data models created are aligned with the real-time scenarios.
Properly Documenting the Data Model
Crafting the best data model does not make any sense if you don’t know how to use it. Thus having solid documentation can help others to know what is information available in the system and make it easy for them to use the data to generate valuable insights.
Proper documentation also helps to onboard the new members of a team at a faster pace and it helps to maintain or alter the data model more easily with a single source of up-to-date data.
Designing an adjustable Data Model
While designing the data model, you have to ensure that the data can be updated and altered with minimal effort. The cons of adding things on the first attempt can look easier and even if you do, the changes will be in the future that need new sets of data to be added up over time. Taking this into account, you can start it from the beginning can save the concern in the future.
Know More : Top Power BI interview Question and Answers
FAQs
How do I learn data modeling in Power BI?
To learn in-depth about data modeling in Power BI, you can take the PL-300 Certification. This certification makes you master Power BI concepts, DAX, Power modeling, and so on.
What is the data modeling method?
Data modeling is the process of visual representation creation with the usage of either whole data or parts of it to make connections between the data points and structures.
Why is data modeling in Power BI important?
Data modeling is important because it:
- Reduces Mistakes: Helps avoid errors when creating computer databases.
- Makes Things Faster: Speeds up the process of designing and building databases.
- Keeps Things the Same: Ensures that data documents and system designs are consistent throughout the organization.
- Bring team collaboration: Makes it easier for the people who build databases to talk to the folks who use the data for business decisions.
Why use data modeling in Power BI?
Using data modeling in Power BI is crucial because it ensures that your Power BI reports work efficiently and can handle larger amounts of data when necessary.
Conclusion
Hope this article helps you to get into the fundamentals of data modeling in Power BI, data modeling concepts, and data modeling best practices. Data modeling in Power BI is a crucial skill in the world of data management and analytics, and it plays a significant role in various professional certifications, including the PL-300 certification.
To prepare for such certification, you can make use of some reliable and authentic resources such as PL-300 exam questions, PL-300 study guides, PL-300 practice tests, etc. Not only theoretical skills can bring success in your analytical career but also you have to level up your practical knowledge.
To hone such skills, Microsoft Power BI hands-on labs and Microsoft Power BI sandboxes are great choices.
- Top 20 Questions To Prepare For Certified Kubernetes Administrator Exam - August 16, 2024
- 10 AWS Services to Master for the AWS Developer Associate Exam - August 14, 2024
- Exam Tips for AWS Machine Learning Specialty Certification - August 7, 2024
- Best 15+ AWS Developer Associate hands-on labs in 2024 - July 24, 2024
- Containers vs Virtual Machines: Differences You Should Know - June 24, 2024
- Databricks Launched World’s Most Capable Large Language Model (LLM) - April 26, 2024
- What are the storage options available in Microsoft Azure? - March 14, 2024
- User’s Guide to Getting Started with Google Kubernetes Engine - March 1, 2024