

We are publishing series of articles on PMP topics to help the PMP exam preparation. One of the critical and most important concept in preparing for the PMP exam is Quality Management tools. In this article we are going to explain you top 7 tools for quality management.
- TRY NOW : 50 PMP Practice Questions
- Access our 15 hours Self-Study Training (Get 35 contact hours certificate)
Quality Management is an integral part of Project Management. For a project manager, ignoring quality management processes could cost a great deal. For a project to be delivered successfully adopting benchmarked quality assurance and quality control systems becomes mandatory. Project Management Principles (PMP) from Project Management Institute (PMI) includes an entire knowledge area on quality, called ‘Project Quality Management’.
Monitoring and Controlling Quality ensures that Project and process are on track and are progressing as per the baseline estimations and requirements. To perform quality control we use various tools and techniques like Inspection and Statistical Sampling. While Inspection refers to ensuring if the product confirms to specified requirements, Statistical Sampling focuses on quantitative analysis of a sample of data to ensure conformance to the target measurements.
Besides these tools, there are other seven tools which are collectively called ‘Seven Basic Tools of Quality’. The primary purpose of each of these tools is to examine the product, service or result as well as the project processes for conformity to quantitative standards.
The list of ‘Seven Basic Tools of Quality’ includes:
- Cause-and-effect diagram
- Control Charts
- Flowcharting
- Histogram
- Pareto chart
- Run chart
- Scatter Diagram
1. Cause-and-effect diagram
Diagrams that define the inputs to a process or product to identify the potential causes of defects are known as Cause and effect diagrams. (Std. Def.)
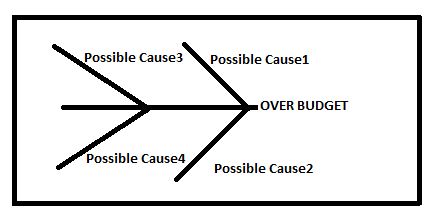
This diagram is also referred to as Fish-bone analysis diagram or Ishikawa diagram. Kaoru Ishikawa was a significant contributor in the realm of Quality. They are used to determine what may have caused a defect. They are very helpful when we need to analyze the root cause of a problem.
For example, referring to diagram 1, we can see that there could be a problem of project going over budget during the course of its execution. The given diagram illustration simply helps us list out the possible causes of the cost over-run. Once the root cause is determined, it could be handled with appropriate resolution and may help in damage control. It could help the project manager save some cost during the future phases of the project.
2. Control Charts
A Control Chart is a graphical display of data over time and against established control limits that has a center line that assists in detecting a trend of plotted values toward either control limits. (Std. Def.)
To explain it in a simple way, Control Charts are a way of visualizing how processes are doing overtime. Control Charts measure the results of processes over time and display the result in graph form to show whether the process variance is in control or out of control.
A process is considered to be in control if the measurements fall within the control limits. So in a Control Chart, there is a mean, a Lower control limit and an Upper control limit.
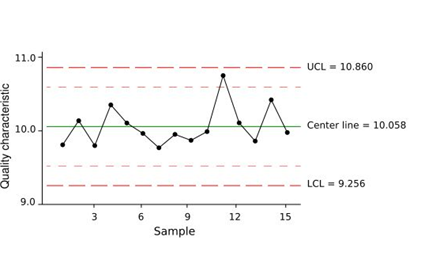
For example, referring to diagram 2.0, let’s say that the acceptable quality characteristic of a component measures 10.0 on an assembly line product manufacturing unit (The metrics of a process are generated after quantifying a process through Key Performance Indicators and also from Historical data.). The chart above shows control limits as dashed lines. The mean is the solid line in the middle. By looking at the chart above, you can see that there are a lot of data points which fall above and below the mean, but they are well within control limits. However, when a data point falls outside of the control limits, we would say that data point is out of control and a corrective action is needed to be taken to control the process.
According to the PMBOK guide, when a process is in control it should not be adjusted. When a process falls out of the acceptable limits, only then it should be adjusted.
It’s pretty normal to have your data fluctuate from sample to sample. But when seven data points in a row fall on one side of the mean, we say that the entire process is out of control. It is also called ‘Rule of Seven’. The ‘Rule of Seven’ states that seven data points trending in one direction up or down, or falling on any one side of the mean indicates that the process isn’t random.
3. Flowcharting
The depiction in a diagram format of the inputs, process actions, and outputs of one or more processes within a system is called a Flow Chart. (Std. Def.)
Flowcharts let you show how processes work visually. You can use a flowchart to show how the tasks in your project interrelate and what they depend on.
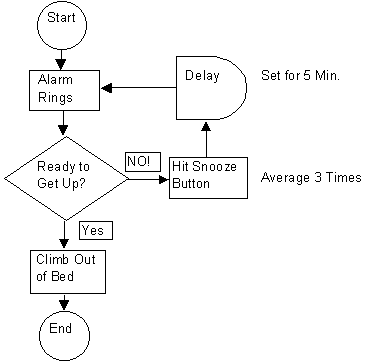
They are also good for showing decision- making processes.
Flow charts are good way to analyze where in the process could the problems occur.
For example, referring to diagram 3.0 on the right shows a small process of descision making to get out of the bed and what would happen if we choose not to. If we decide not to get up, how would the process react and what will be the possible outcomes, until we decide to really get out of the bed.
The flowchart helps you to see how all of the phases relate to each other. Flowcharts help us get a hold on the way we are working by showing us a picture of the whole process. In other words, flowcharts are diagrams that show the logical steps to be carried out in order to accomplish an objective.
4. Histogram
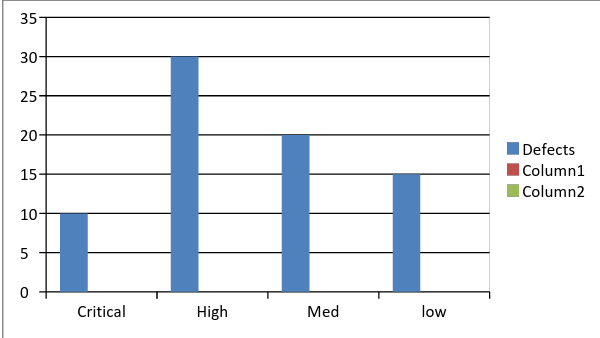
A bar chart showing a distribution of variables over time, is called a Histogram. (Std. Def.)
Histograms give us a fair idea of how our data breaks down. It shows the distribution of data over various streams ranging from resource allocation to budget distribution.
For example, referring to diagram 4.0, if we found out that our product has 75 defects, we may still need a clear idea of there severity. We cannot assume if they were all critical. So looking at a chart like the one below would help us get some perspective on the data. A lot of the bugs are high, medium or low priority. It looks like only 10 or so are critical. Histograms are great for helping you to compare characteristics of data and make more informed decisions. This product probably isn’t ready to be delivered yet as it still has alot of high severity bugs, but at least we know that the bugs arent all critical!
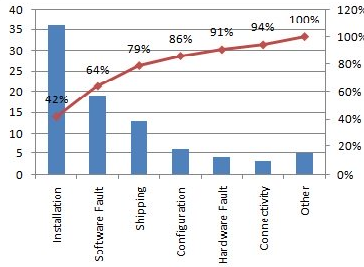
5. Pareto Chart
A bar chart ordered by the frequency of occurrence, that shows how many results were generate by each identified. (Std. Def.)
Pareto Analysis is a statistical technique used in selection of a limited number of tasks that produce significant overall effect. Pareto charts help us to figure out which problems need our attention right away. They’re based on the idea that a large number of problems are caused by a small number of causes which is based on the Pareto Principle.
The Pareto Principle was discovered by a 19th century Italian economist and sociologist named Vilfredo Pareto (1848 – 1923). During his research on the distribution of wealth in Italy, he observed that 80 percent of the wealth and land ownership was held by 20 percent of the population. In fact, that’s called the 80/20 rule and applies to many other disciplines and areas. It goes on to say that 80 percent of the problems are usually caused by 20 percent of the causes.
For example, refering to diagram 5.0, the Pareto charts plot out the frequency of product faults and sorted in descending order. This particular Pareto chart divides problem areas into seven categories, which are always ordered from most to least faults found. The right axis on the chart shows the cumulative percentage. We observe that most of the product problems are caused by installation issues. So, improving the way products are installed could be one of the ways to resolving 40% issues besides taking care of the Software faults and shipping faults, to prevent failure of the product in the market.
It clearly shows that only these three categories combined account for causing 79% of faults in the product.
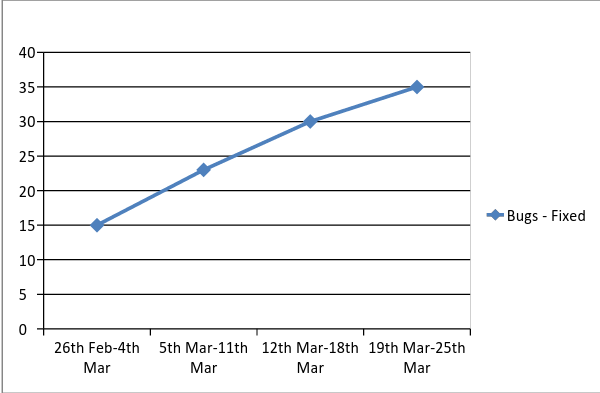
6. Run Chart
A run chart is a line graph of data plotted over time used to show trends in the variation of a process. (Std. Def.)
Run charts are often used in conjunction with Control charts. By collecting and charting data over time, we can find trends or patterns in the process. Because they do not use control limits, run charts cannot tell you if a process is stable.
Run charts tell you about trends in your project by showing you what your data looks like as a line chart. If the line in the chart were the number of defects found in your product through each quality activity, that would tell you that things were getting worse as your project progressed. In a run chart, you are looking for trends in the data over time. You could check the chart to see if it seem to be going up or down as the project progresses.
For example, referring to diagram 6.0 below, as the given software development project progressed, we observed that the trend of fixing the bugs was slower in the initial phase of software testing. However, as more and more bugs were generated by the tester, the developers started focusing on fixing more bugs to ensure delivery on-time and on-budget.
‘Trend Analysis’ is another technique which is supported by Run Charts. If we have historical data and current data, by using mathematical statistics of business intelligence, we could predict the future outcomes and a representation could be made using Run Charts.
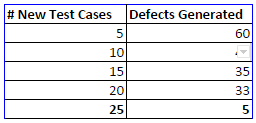
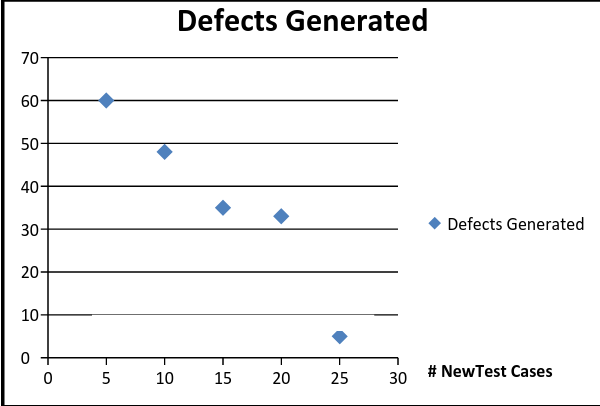
7. Scatter Diagrams
A scatter diagram, or scatter graph is a graphical representation of quantitative analysis on mathematical statistics of two variables, using Cartesian coordinates.
Scatter diagrams show how two different types of data could relate to each other and show the progress of work. Scatter diagrams use two variables, one called an ‘independent variable’, which is an input and the other called the ‘dependent variable’, which is an output. This relationship is also analyzed to prove or disapprove cause and effects relationship between the variable.
For example, referring to diagram 7.0 below, if the test team worked to create a bunch of new test cases, we might use a scatter diagram to see if the new test cases had any impact on the number of defects we found. The chart here shows that as more test cases pass, 10 fewer defects are found. When the number of tests passing goes up, fewer defects are found. The Scatter diagram will display the relationship between these two elements – No of Test Cases(as the Independent Variable) and No of Defects (as the Dependent Variable), as points on graph. The defects are scattered on the graph in such a way that it reflects when the number of tests passing goes up, fewer defects are found.
The result shows a positive correlation between the variables.
- TRY NOW : 50 PMP Practice Questions
- Access our 15 hours Self-Study Training (Get 35 contact hours certificate)
References
- PMBOK 5th Edition – (Project Management Body of Knowledge) – PMI
- Project Management Professional Exam study Guide- 5th Edition – Kim Heldman
- PMP Certification- ALL-IN-ONE for Dummies (a wiley brand) – Cynthia Snyder
- PMP Headfirst- 3rd Edition- O’Reilly- Jennifer Greene and Andrew Stellman
- Google Research and Analysis and MS Word Charts and Bar Graph
If you are looking for any help in preparing for the PMP certification exam, please call too our customer support or send a mail.
- Top 20 Questions To Prepare For Certified Kubernetes Administrator Exam - August 16, 2024
- 10 AWS Services to Master for the AWS Developer Associate Exam - August 14, 2024
- Exam Tips for AWS Machine Learning Specialty Certification - August 7, 2024
- Best 15+ AWS Developer Associate hands-on labs in 2024 - July 24, 2024
- Containers vs Virtual Machines: Differences You Should Know - June 24, 2024
- Databricks Launched World’s Most Capable Large Language Model (LLM) - April 26, 2024
- What are the storage options available in Microsoft Azure? - March 14, 2024
- User’s Guide to Getting Started with Google Kubernetes Engine - March 1, 2024
Great information. Thanks for the post.
Thank you!
Thanks for the simplicity.
However, i think the Scatter Diagram correlation is NEGATIVE instead of being POSITIVE. That’s because as the independent variable (New Text Cases) are going UP, the dependent variable (Defects) are going DOWN. Therefore, a NEGATIVE correlation.
May be a further explanation will do for me if i’m wrong with this.
How to ban a person from a blog on blogspot?