Microsoft Fabric and Power BI are popular data analytics tools that can help organizations maximize their data and prepare for success in the AI era.
To learn MS Fabric, get certified with Exam DP-600: Implementing Analytics Solutions Using Microsoft Fabric – this helps you build skills in designing, creating, and deploying enterprise-scale data analytics solutions.
For Power BI, ace the Microsoft Power BI Data Analyst Exam (PL-300 exam) and learn how to visualize and analyze data by using Power BI while designing data models, developing dynamic reports and dashboards, and managing data security Power BI.
But which is the best data analytics tool for your needs? What is the difference? What are the factors to consider when choosing between the two? This blog will discuss everything you need to know about Power BI and answer these questions in great detail.
Let’s dive in.
What is Microsoft Fabric?
Microsoft Fabric is a comprehensive data management platform integrating advanced analytics, data storage, and AI capabilities into a cohesive framework. Built on Microsoft’s multi-cloud data lake, OneLake, Fabric offers a Software-as-a-Service (SaaS) experience, enabling businesses to seamlessly manage, analyze, and visualize their data.
By combining the features of existing Microsoft tools like Azure Synapse and Power BI, Fabric creates a streamlined environment for enterprise data solutions.
The platform includes seven core workloads:
- Synapse Data Science
- Synapse Data Warehousing
- Data Factory, Data Activator
- Synapse Real-Time Analytics
- Synapse Data Engineering
- Power BI
Each workload is designed to function cohesively within the unified architecture, allowing businesses to handle complex data processes from ingestion to insights within a single interface. This integration promotes efficiency and eliminates the need for multiple disparate tools.
As an end-to-end solution, Microsoft Fabric simplifies the storage and management of large volumes of data while enhancing data accessibility and intelligence across organizations. Launched in preview at Microsoft Build 2023, it aims to support enterprises by providing all necessary tools for data integration, engineering, and analytics in one place, facilitating better communication and decision-making across various business units.
Features of MS Fabric
- Unified Analytics Platform: Combines data science, BI, and real-time analytics in one solution.
- OneLake Core: Centralized data storage, enhancing accessibility and analysis.
- Scalable Real-Time Analytics: Empowers businesses to process and analyze data as it arrives.
- AI Integration: This feature incorporates Azure AI to streamline and enhance data operations. Starting May 20th, 2024, Copilot in Microsoft Fabric will be enabled by default for all tenants.
- Comprehensive Data Solutions: Merges existing and new Azure functionalities, providing a robust environment for all data needs.
- Innovative User Assistance: Features like GPT-powered Copilot help optimize data workflow and decision-making.
- Enhanced Security: Centralized data governance and security across all platforms.
What is Power BI?
Microsoft Power BI is a powerful business intelligence platform that transforms complex data into actionable insights with rich visualizations and detailed reporting. This self-service tool is designed for ease of use, enabling businesses to make informed decisions by converting raw data into intuitive charts, dashboards, and reports.
Whether the data comes from Excel spreadsheets, Azure, or SQL databases, Power BI makes it accessible and engaging, effectively revealing the story hidden within the numbers.
Power BI excels in integration capabilities, combining data from various sources using built-in connectors to provide a unified information view.
The platform supports real-time analytics, allowing users to see up-to-the-minute data and collaborate through Microsoft ecosystem tools like Teams and Excel. Additionally, as an AI-powered tool, it offers advanced analytics features such as image recognition and text analytics, further enhancing the data visualization process.
Features of Power BI
- Custom Visuals with Python: This module supports custom visualizations using Python’s data-viz libraries, allowing for personalized and intricate graphical representations.
- Large Data Sets: Efficiently handles large datasets with a powerful compression mechanism to streamline insight extraction.
- Versatile Application Integration: This includes various versions, such as Power BI Premium, Pro, Desktop, Mobile, and Report Server, catering to different user needs.
- Interactive Reports: Offers various visualization styles, from graphs and charts to scatter plots, enhancing data report aesthetics and understanding.
- Collaboration and Sharing: Integrates seamlessly within the Microsoft environment, facilitating data sharing and collaborative decision-making through applications like SharePoint and Teams.
- Automated AI Insights: Employs AI to automate complex data analysis tasks, such as quick insights and predictive analytics, making advanced data science accessible to all users.
- Real-Time Data Processing: Enables real-time data analysis, ensuring that decision-makers have the most current information at their fingertips.
- Data Integration: Smoothly connects with other Microsoft tools, allowing users to merge and analyze data across platforms for enriched insights.
Microsoft Fabric vs Power BI: What’s The Difference
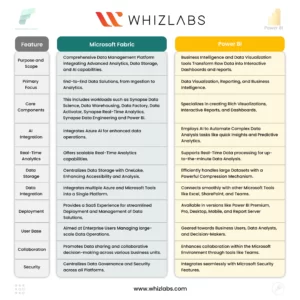
Microsoft Fabric and Power BI offer unique data management and analytics capabilities, yet they serve distinct organizational roles. Here’s a detailed comparison to highlight how each platform caters to different aspects of your data needs:
Microsoft Fabric vs Power BI: Purpose of Platforms
Microsoft Fabric is a comprehensive analytics solution tailored for enterprises. It aims to provide a unified platform for business users and data analysts to collaborate seamlessly. Fabric encompasses everything from data movement and data science to real-time analytics and business intelligence.
By integrating various analytics processes into one platform, Microsoft Fabric simplifies the complex landscape of enterprise analytics, making it more accessible and streamlined for businesses of all sizes.
Power BI, on the other hand, is an interactive data visualization software focused on business intelligence. It is designed to transform raw, unrelated data sources into coherent, visually immersive, and interactive insights.
Power BI’s primary goal is to empower businesses to make informed decisions by comprehensively visualizing their data.
Microsoft Fabric vs Power BI: Integration Capabilities
Microsoft Fabric integrates multiple technologies, such as Data Science, Data Engineering, Real-Time Analytics, and Power BI, into a unified SaaS platform. This deep integration offers numerous benefits, including comprehensive analytics, shared user experiences across different tools, and a unified data lake that supports and connects various analytics processes.
Power BI also demonstrates impressive integration capabilities, effortlessly connecting with diverse data sources such as databases, webpages, or structured files. However, unlike Fabric, Power BI is primarily an independent business intelligence tool focused on deriving actionable insights from data.
Microsoft Fabric vs Power BI: Architecture and Components
Fabric is built on a robust architecture comprising various components:
- Data Lake: A secure and scalable repository that stores all data formats and structures.
- Data Engineering: An integrated suite for transforming and preparing data, optimizing it for insightful analysis.
- Data Integration: Platforms connecting various data sources for seamless movement and synchronization.
- Machine Learning: A platform for developing and deploying advanced machine learning models.
- Business Intelligence: Specialized tools for data visualization and in-depth analysis, translating raw data into actionable insights.
Power BI’s ecosystem, compared to Fabric, includes:
- Power BI Desktop: A desktop application for creating and publishing reports and dashboards.
- Power BI Online: A cloud-based service offering functionalities similar to Power BI Desktop, accessible from any online system.
- Power BI Mobile: Applications for iOS, Android, and Windows devices, enabling users to view and interact with reports and dashboards on the go.
Will MS Fabric Replace Power BI?
A common misconception is that Microsoft Fabric will replace Power BI, but this isn’t true. MS Fabric enhances Power BI’s functionality with a broader scope, including data preparation, integration, and more.
Power BI excels at creating interactive dashboards and reports, while Microsoft Fabric complements it by tackling the complexities of data preparation and integration. Fabric offers a robust suite of tools, including AI-powered features and advanced data analysis capabilities, making it a comprehensive solution for various data-related tasks.
Microsoft Fabric vs Power BI: Which One Is Right For You?
The best choice for you depends on your specific needs and requirements. Microsoft Fabric is an excellent option if you are looking for a comprehensive analytics solution that can manage your entire data pipeline.
The all-in-one approach is ideal for businesses investing in multiple tools and technologies to maintain data cycles. On the other hand, if you need a BI tool to visualize and analyze your data, Power BI is the way to go. It’s user-friendly and packed with features that help non-technical users maximize the value of their data.
Microsoft Fabric vs Power BI: What To Consider When Choosing One
Consider these three things before you settle with one of these data tools.
Scalability:
Both Microsoft Fabric and Power BI are scalable solutions. However, with its comprehensive suite of services, Microsoft Fabric is better suited for large enterprises with complex data analytics needs. Power BI, which provides excellent business intelligence insights through its cloud-based services, is less complex and tailored for users seeking straightforward BI functionality.
Learning Curve:
Microsoft Fabric’s extensive capabilities result in a steeper learning curve than Power BI. Power BI is more intuitive and user-friendly, particularly for those familiar with other Microsoft products like Excel.
Cost:
Power BI offers a free version with limited capabilities, making it accessible for smaller budgets. In contrast, as an all-in-one solution, Microsoft Fabric will likely have a higher price once officially launched. Fabric is free for existing Power BI customers to try out during the preview phase.
Conclusion
This blog helps you understand the difference between Microsoft Fabric and Power BI and gain a holistic view of both tools. Power BI is the primary tool for creating visually appealing and interactive data presentations.
Think of it as the front-end artist. Meanwhile, Microsoft Fabric is the backstage technician, ensuring that data is perfectly orchestrated and enriched with insights from advanced analysis and AI-driven algorithms.
If you want to learn more about these tools, the best way to kickstart your journey is to go for certification courses.
Whizlabs offers extensive training materials for both of these certifications. You get numerous practice papers with exhaustive answers and unique questions, nuanced video lectures designed by industry experts, hands-on labs, and sandboxes to brush up on your practical skills and experiment in a dummy Azure environment. Want to learn more about these certs? Talk to us today!
More on MS Fabric and Power BI
Study Guide DP-600: Implementing Analytics Solutions Using Microsoft Fabric Certification Exam
What is Data Modeling in Power BI?: An Ultimate Guide
- How GCP Cloud Engineers Handle Security & IAM - May 15, 2025
- What Is Amazon Redshift and How Does It Work? - April 28, 2025
- What Is the Role of AWS Lambda in AI Model Deployment? - April 2, 2025
- What Are ETL Best Practices for AWS Data Engineers - March 17, 2025
- How to Create Secure User Authentication with AWS Cognito for Cloud Applications - September 30, 2024
- 2024 Roadmap to AWS Security Specialty Certification Success - August 16, 2024
- Top 25 AWS Full Stack Developer Interview Questions & Answers - August 14, 2024
- AWS Machine Learning Specialty vs Google ML Engineer – Difference - August 9, 2024


