
Amazon Quicksight is a cloud-based business intelligence service and it can be employed to retrieve simple insights with the data collected from anywhere. It connects data retained in the cloud and combines the data from varied sources.
In today’s digital landscape, tons of information is generated and people are struggling to make informed decisions by spending a lot of time analyzing those data. To put an end to this issue, Amazon Quicksight emerge as a one-stop solution.
As a certified AWS Cloud Practitioner professional, you need to employ Amazon Quicksight to integrate data from various sources such as AWS cloud, third-party, big data, spreadsheet, SaaS, B2B, and others into a single data dashboard. Thus it helps the users to provide useful insights and level up business intelligence in an organization.
In this blog, we are going to know how we can improve business intelligence with the help of Amazon QuickSight in detail.
Let’s dig in!
What is Amazon QuickSight?
Amazon QuickSight, being a fully managed cloud-based service, provides enterprise-level security, global accessibility, and inherent redundancy. It comes equipped with user-management tools, allowing scalability from 10 to 10,000 users without the need for deploying or managing any infrastructure.
Decision-makers can leverage QuickSight to analyze and interpret data within an interactive visual environment. Secure access to dashboards is facilitated from any device on the network, including mobile devices.
Amazon QuickSight Features
Let’s go through some of the features of Amazon QuickSight:
- Business intelligence: Amazon QuickSight uses an ML-powered engine to carry out the visualizations using data preparation from authors and administrators within a shorter time.
- Advanced analytics: Utilizing AWS’ expertise in machine learning, advanced analytics becomes possible. This enables the discovery of hidden patterns in your data, facilitating precise forecasting and what-if analysis. Additionally, you can enhance dashboards by incorporating easily understandable natural language narratives.
- Integrate analytics to set your applications apart: To distinguish user experience and unlock new monetization opportunities, effortlessly incorporate interactive visualizations, dashboards, sophisticated dashboard authoring, or natural language query capabilities into your applications.
Terminologies used in Amazon QuickSight
| Term | Definition |
| Data Preparation | The process of transforming data for analysis involves actions such as filtering data for relevance, renaming fields for clarity, changing data types for utility, adding calculated fields for enhanced analysis, and creating SQL queries for data refinement. |
| SPICE | SPICE (Super-fast, Parallel, In-memory Calculation Engine) is QuickSight’s robust in-memory engine designed for rapid advanced calculations and data serving. It accelerates analytical queries by utilizing storage and processing capacity, eliminating the need to retrieve data every time an analysis or visual is modified or updated. |
| Data Analysis | The foundational workspace for creating data visualizations encompasses a collection of visualizations that users can arrange and customize. |
| Data Visualization | Also known as a visual, it is a graphical representation of data, including diagrams, charts, graphs, and tables. All visuals start in AutoGraph mode, automatically selecting the best visualization type based on selected fields. Users can customize visuals by applying filters, changing colors, adding parameter controls, custom click actions, and more. |
| Machine Learning Insights | Proposes narrative add-ons based on an evaluation of data, offering options such as forecasting or anomaly detection. Users can choose from a list or create their own, combining insight calculations, narrative text, colors, images, and defined conditions. |
| Sheet | A page displaying a set of visualizations and insights, akin to a newspaper page filled with charts, graphs, tables, and insights. Users can add multiple sheets, working independently or together in an analysis. |
| Dashboard | The published version of an analysis, shared with other Amazon QuickSight users for reporting purposes. Users specify access permissions, determining what others can do with the dashboard. |
How does Amazon QuickSight work?
With the help of Amazon QuickSight, you can access the data and prepare it to generate the reports. It saves the prepared data in direct query format or SPICE memory. You can employ a wide range of data sources for the data analysis. During the data analysis process, the following workflow has been employed:
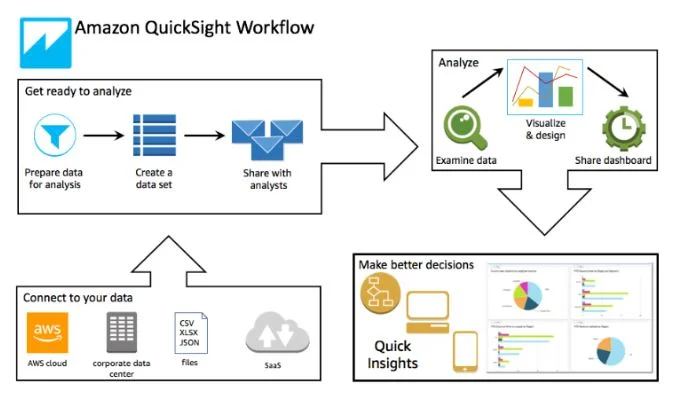
Image: Source
- Creation of new analysis
- Adding the existing datasets or new ones
- Selecting the required field to create the chart. Now, QuickSight suggests the best visualization automatically
- Now you can add more charts, insights, or tables to the analysis. Now reuse and rearrange the data on one or more sheets. Utilize the extended features to add variables, additional pages, custom controls, and much more
- Publish the data analysis as a dashboard and share it with others
Let’s see the detailed working of Amazon QuickSight
To create Amazon QuickSight with interactive dashboards and insights, you have to:
- Collect and load data: Amazon QuickSight aggregates and collects the data from the various AWS utilities such as AWS Redshift, Amazon Athena, Amazon Aurora, etc. It also integrates with the databases, API-based data sources, and file uploads. Sales orders, IoT devices, financial data, and click streams are also supported by AWS Quicksight. It provides the flexibility to the end users to upload the data in a file or as an AWS S3 bucket.
- Connect to data: Amazon QuickSight can connect to the data irrespective of where they are from. It connects to the AWS Cloud, third-party applications, corporate data centers, or SaaS applications. It also prepares the data before the data analysis. This type of data preparation includes processes such as data filtering, field renaming, altering the data type, and creation of SQL queries.
- Analyze data: Amazon QuickSight’s BI platform performs the data analysis and employs efficient, parallel, Super-fast, Parallel, In-memory Calculation Engine (SPICE) to create the charts through calculations. The storage and processing capacity of the engine eliminates the need to retain the data every time whenever the analysis is altered or updated visually.
- Create Visualizations: Amazon QuickSight makes it easy for users to generate visual representations of data that can be tailored and personalized to meet their specific requirements. This eliminates the need for manual extraction, transformation, and loading tasks. In the QuickSight workspace, users have access to a variety of interactive elements, such as graphs, charts, tables, stories, sheets, and more.
To initiate the creation of a visualization, log in to the AWS Management Console, locate Amazon QuickSight, and set up a QuickSight account.
Select a subscription type (standard or enterprise edition), choose a pricing plan, specify the region for data storage, and decide whether to allow automatic discovery of data from other AWS services.
Data Loading: Once your QuickSight account is established, commence a new analysis by importing data into the tool. You can create a new dataset by extracting information from an existing data source or uploading a file.
Direct querying of databases is supported, but for other data sources, QuickSight relies on SPICE (Super-fast, Parallel, In-memory Calculation Engine) to efficiently handle large datasets and provide swift results. Additionally, you can import datasets from databases into SPICE to enhance performance.
Each Amazon QuickSight account receives 10GB of SPICE capacity for a paid user and 1 GB for a free user.
You can increase your account’s capacity up to 1TB by paying for additional capacity, with the option to request capacity beyond this limit if needed. The admin page in QuickSight displays your remaining SPICE capacity and allows you to delete datasets from SPICE to free up space for analyzing other data.
Data Preparation: Once data is loaded into the tool, prepare it for analysis. This involves tasks such as deleting unnecessary columns, adding calculated fields, applying data filters, formatting columns, or modifying field names and data types. Prepared datasets can be saved for use in multiple analyses.
Creating Data Visuals: After data preparation, proceed to create a visualization. QuickSight supports more than a dozen visualization types, including bar charts, pie charts, pivot tables, and heat maps. If you’re uncertain about the best visualization type, QuickSight’s AutoGraph feature can automatically choose an appropriate one.
- Customize visualizations by adjusting fields, rewriting titles, and changing visual elements using drag-and-drop functionality.
- Combine visualizations into an analysis, QuickSight’s term for a group of visuals or stories. Each analysis can include up to 20 data sets and 20 visuals. Connect and present multiple iterations of an analysis together to convey a comprehensive business story.
Sharing Data: Utilize analyses to create dashboards, and read-only snapshots for reporting data via a web browser or mobile app. Share dashboards and datasets with other QuickSight users and groups, or publish a dashboard by sending a link to all subscribers via email. Additionally, email links to analyses can be sent to other QuickSight users in your account.
The tool allows users to share these interactive visualizations through dashboards, email reports, and embedded analytics. Business users can access these resources to gain insights and take necessary actions.
With embedded analytics, users can view create, and customize dashboards within their enterprise applications. This makes the process of deriving insights and making informed decisions a seamless experience for users.
Also Read : How to turn on intelligent Threat Detection using Amazon GuardDuty
AWS QuickSight Pricing
Amazon QuickSight introduces a pioneering approach to business intelligence services with its pay-per-session pricing model, offering cost-effectiveness for large-scale deployments. With pay-per-session, companies only incur charges when users access dashboards or reports.
There are two editions of AWS QuickSight, each with its pricing structure:
AWS Quicksight Standard Edition
- Designed for personal use, specifically for individual data analysis and exploration.
- Available for authors or dashboard publishers at $9/month with an annual subscription or $12 for monthly payments.
AWS Quicksight Enterprise Edition
- Geared towards large-scale usage and is suitable for both authors or dashboard publishers and readers.
- Pricing for readers is $5/month per user. However, the pricing based on readers’ session capacity is $250/month for every 500 sessions.
- For authors, the pricing is $18/month with an annual subscription or $24 for a monthly subscription.
This flexible pricing structure allows users to choose the edition that aligns with their usage needs, providing affordability and scalability for both personal and large-scale analytics initiatives.
Benefits of using Amazon QuickSight
There are numerous benefits of employing Amazon QuickSight and they are:
- Flexible – No Spatial Constraints: QuickSight is designed to provide business users with ample flexibility, free from the limitations of a conservative cloud design. Users can manipulate extensive datasets without needing in-depth knowledge of the underlying workings. Upon logging in, users are directed to dashboards where they can swiftly create visualizations. With a top-tier data engine and comprehensive documentation, the tool’s flexibility grows with each use.
- Smart Interactive Visualizations: The SPICE calculation engine facilitates the modeling of precise processes, retrieving required data faster than conventional methods. Its built-in visualization tool generates suggestions by recognizing patterns in backend datasets. The ‘Autograph’ feature evolves to accurately predict data analyses based on users’ analytical patterns over time.
- Self-Service Analyses: Business users are empowered with self-service exploratory analytics. The dashboard’s GUI allows users to slice and dice data for the desired analysis, saving them as stories. These stories can be shared within the organization. This unique option enables users to perform self-service analytics by visualizing all analyses and stories on the dashboard, generating the most optimal outcome, and customizing the app accordingly.
- Highly Scalable: Amazon QuickSight can be employed across various business domains to measure business metrics independently. It is scalable across tens of thousands of users who can work independently and simultaneously across all data sources.
FAQs
Is AWS QuickSight serverless?
Yes, AWS QuickSight is serverless. It can automatically scale to accommodate tens of thousands of users without requiring any infrastructure management or capacity planning.
Give examples of Amazon QuickSight.
Here are some examples of Amazon QuickSight:
- Analyze Related Tweets by Phrase
- Filter Tweets by Entity
- Identify Tweets with Unsafe URLs
What are the use cases of Amazon QuickSight?
Here are the common use cases of Amazon QuickSight:
- Connecting to Operational Databases
- Connecting to Data Warehouses
- Connecting to Data Lakes
Conclusion
Hope this write-up entails everything you need to know about Amazon QuickSight.
Whether you’re a small startup or a large enterprise, Amazon QuickSight can serve as a valuable tool to unleash the untapped potential of your data and gain a competitive advantage in today’s dynamic marketplace.
To know the full potential of Amazon QuickSight in real-time, go through our AWS hands-on labs and AWS Sandboxes.
- Top 25 AWS Data Engineer Interview Questions and Answers - May 11, 2024
- What is Azure Synapse Analytics? - April 26, 2024
- AZ-900: Azure Fundamentals Certification Exam Updates - April 26, 2024
- Exam Tips for AWS Data Engineer Associate Certification - April 19, 2024
- Maximizing Cloud Security with AWS Identity and Access Management - April 18, 2024
- A Deep Dive into Google Cloud Database Options - April 16, 2024
- GCP Cloud Engineer vs GCP Cloud Architect: What’s the Difference? - March 22, 2024
- 7 Ways to Double Your Cloud Solutions Architect Role Salary in 12 Months - March 7, 2024