AWS CloudWatch Logs intend to help developers store, access and monitor the log files within the Amazon EC2 instances. Apart from that, you can also access slog files from Route 53, AWS CloudTrail, and other such sources. But, AWS CloudWatch is most preferable with the Amazon EC2 instances.
The potential of AWS CloudWatch allows centralization of the logs from all of the apps, AWS services, and systems. One can easily view the logs, search for the errors, filter them and store them with security concerns. Not just that, but users can also query their logs, to sort them, depending upon the dimensions and specific fields. To know more about the functionality of AWS CloudWatch, refer to this article: (Link the previous article here).
But before you can utilize the functionality of AWS CloudWatch, it is important that you understand how to set it up. Therefore, this article intends to help you understand the set-up procedure for Amazon CloudWatch Logs.
The Initial Set-up of AWS CloudWatch logs
The first thing that you need to do for using AWS CloudWatch logs is creating an AWS account. You won’t be able to access the services and facilities of AWS without a dedicated account for the same. Creating an AWS account will allow you to use Amazon EC2, which will generate logs for you to view in the CloudWatch console.
The steps for signing up to Amazon Web Services are as follows:
- Open this portal to commence with the sign-up process!
- Follow the specified instructions.
- Fill in the required details.
- You will need to enter your phone number for account security purposes, with code verification.
Once you have created the account over AWS, you can then proceed with signing in to the AWS CloudWatch Console. Here are the steps to help you with the same:
- Sign in to AWS Management Console.
- Open the CloudWatch console by clicking on this portal.
- Choose the region where you have your AWS resources.
- Choose logs from the navigation pane.
Moreover, you can also integrate the use of AWS CLI for performing the CloudWatch Logs operations. Follow the specified steps over this link to set up the AWS Command Line Interface.
Install & Configure the CloudWatch Logs Agent on a Running EC2 Linux Instance
The developers can prefer to use the CloudWatch Logs agent installer over any of the existing EC2 instances. It is meant to install & configure the CloudWatch logs agent. Once the installation is done, the logs automatically flow from the EC2 instance to the log stream. Follow these steps for the same:
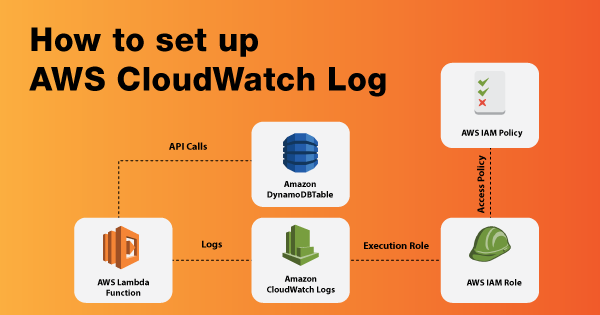
Step 1: Configure the IAM Role for the CloudWatch Logs
- Access the IAM Console by logging onto this link.
- When you have entered the navigation pane, choose Roles.
- Choose the Role by choosing one amongst the role names.
- Please do not check the box that is next to the name of the roles.
- Choose the ‘Attach Policies’ tab and click on ‘Create Policies.’
- You will see a new tab opening up in your browser, or a new window will pop up.
- Choose the JSON tab, and then you will have to type out the JSON policy document over it.
{ "Version": "2012-10-17", "Statement": [ { "Effect": "Allow", "Action": [ "logs:CreateLogGroup", "logs:CreateLogStream", "logs:PutLogEvents", "logs:DescribeLogStreams" ], "Resource": [ "*" ] } ] } - Now, click on Review Policy to find any syntax errors.
- Type a name and description over the ‘Review Policy’ page for the policy that you are creating.
- Now, review the policy summary to check on the permissions that have got a grant by the policy.
- Now, choose ‘Create policy; to save the work.
- Now, return to the ‘Add Permissions’ page for the Role.
- Click on ‘Refresh’ and then choose the new policy for attaching it to your Role.
- Now, click on ‘Attach Policy.’
Step 2: Install & Configure the CloudWatch Logs on Amazon EC2 Instance
- Connect to the Amazon Linux Instance.
- Update the Linux Instance for picking up all of the latest changes within the repositories.
- Now, install the AWS logs package by following this method, ‘sum yum install -y awslogs.’
- Edit the /etc/awslogs/awslogs.conf file, for configuring the logs that you wish to track.
- By default, the logs are pointed to a different region, and you can tweak the respective code to change the region.
- Now, you need to start the awslogs service using the dedicated command.
- You will then see the new log group, along with the log stream within the CloudWatch Console.
Setting up a CloudWatch Alarm for an EC2 Instance
If you have an idea about AWS CloudWatch logs, then you probably know about its feature of setting the alarm for monitoring the CloudWatch metrics for any of the select instances. By setting the alarm, CloudWatch will automatically send a notification when the select metric reaches the appointed threshold.
Here are the steps that you need to follow in order to create an alarm over CloudWatch, with the use of the Amazon EC2 console. The steps are as follows:
- Open up the EC2 console by logging onto this link!
- Log onto the navigation pane, and choose instances.
- Select the instance, choose the ‘Actions, Monitor and Troubleshoot’ tab and go to ‘Manage CloudWatch Alarms.’
- On that redirected page, go to ‘Add or edit Alarm.’
- Now select ‘Create an alarm.’
- Now select whether you want to turn on or off the alarm notification. After that, you can go to configure Amazon SNS notifications by entering the desired SNS topic. You can select the existing topic or create a new one.
- Now, you need to enable or disable the alarm action, to ensure the outcomes when the threshold is triggered. You will get a dropdown menu to select from.
- Select the criteria and metric of the alarm for setting the alarm threshold.
- Now, choose ‘Create,’ and your alarm is created, for instance, over CloudWatch.
To know more about how you can use the CloudWatch alarms, visit this dedicated documentation offered by AWS.
Setting up a Dashboard over AWS CloudWatch Logs
One of the most important things within the integration of Amazon CloudWatch logs is its dashboard. Therefore, it is important for individuals to adapt the steps of creating single or multiple dashboards. You can do it within the AWS CloudWatch console, and the steps are as follows:
- Log onto your CloudWatch console by logging onto this link!
- Now, as you are in the navigation pane, select ‘Dashboards,’ and then go to ‘Create Dashboards.’
- Within the popped-up dialog box, you need to enter a name for the specific dashboard, and then go ahead and click on ‘Create Dashboard.’
- The name you use for creating the dashboard will appear on the CloudWatch homepage. If you are naming the dashboard in terms of the resource group, then it will appear on the homepage of CloudWatch while focusing on the resource group.
- When you are on the dialog box, after clicking on ‘Add to this dashboard,’ you can either add graphs, add a numeral metric display, or a text block to your dashboard.
- You need to select the respective tabs to add a metric graph, metric numbers, or text block to create widgets for your dashboard.
- You can add numeral widgets to your dashboard by further clicking on ‘Add Widget.’
- Now, when you are done with the inclusion of the widgets, click on ‘Save Dashboard.’
Viewing the Available CloudWatch Log Metrics
Metrics undergo grouping in terms of namespace and by the dimension combinations of each of them. For instance, you get the accessibility to view all of the EC2 metrics, either by themselves, grouped by Auto Scaling, or grouped by EC2 instance. The AWS services that you use are the only ones that will send metrics to AWS CloudWatch.
Here are the steps that you need to follow in order to view the available metrics by dimension and namespace, with the help of the CloudWatch console. The steps are as follows:
- Gain access to the CloudWatch console.
- When in the navigation menu, go ahead and choose Metrics.
- Select a metric namespace within the list.
- Now, choose the metric dimension.
- Now, go to the ‘All Metrics’ tab. It will display all of the metrics within that dimension in the namespace.
- For sorting the table, you can use the column heading.
- If you wish to graph any of the metrics, then you have to select the check box next to the metric.
- You can filter by resource; you need to choose the specific resource ID, go ahead and choose ‘Add to Search.’
- You can filter by metric names as well.
- You can add the graph to the CloudWatch dashboard by selecting ‘Actions’ and ‘Add to Dashboard.’
Follow these steps, and you will be able to view and graph all of the available metrics within the CloudWatch logs.
Creating a Canary within the CloudWatch Logs
CloudWatch console has a blueprint to help you create your canary. You can prefer to write your own script for the purpose. To know more about using canary blueprints, check out this link! But for now, learn about the steps of creating a canary with the use of AWS CloudFormation, upon using your script. The steps for creating a canary are as follows:
- Access your CloudWatch Console.
- Go to the navigation pane, and choose the option ‘Canaries.’
- Now, look for the tab, ‘Create Canary.’
- Now, you get to choose one of the different options.
- If you want to create your canary on one of the several blueprint scripts over CloudWatch, then choose ‘Use a Blueprint.’ Following that, you can choose the type of canary that you are willing to create. (OR)
- If you wish to upload a Node.js script for creating one of the custom canaries, then you need to go ahead and choose ‘Upload a Script.’ Drag the script onto the area of ‘Script.’ You can also choose ‘Browse Files’ for uploading the script from your system. (OR)
- If you wish to import the script from the Amazon S3 bucket, then you need to select the option, ‘Import from S3’. For that, you need to access the ‘Source Location’ and enter the entire path of your canary. If not that, then you can go through the option ‘Browse S3’.
- After you have chosen one amongst the steps 5,6, or 7, you can now enter the name of the canary. Enter the desired name under the dedicated ‘Name’ tab. Keep the name distinctive from all other canaries.
- Under the tab, ‘Application or Endpoint URL,’ you need to enter the URL for the canary to run its test.
- Give the entry point within the Lambda Handler in case you are using your own script. Use a. handler string for the purpose.
- For the use of environment variables within your script, make sure to choose ‘Environment Variables’ to specify a value for each space within the script.
- Now, move to the scheduling part, and choose whether you have to run this new canary for once or make it run continuously with the use of a rate expression or cron expression.
- Moving onto the ‘Data Retention tab, you need to specify the time of how long you want to retain the information for both successful and failed canary runs. This range allows you to select between 1 to 455 days.
- Select the S3 bucket within the ‘Data Storage’ field.
- Under the field of ‘Access Permissions,’ choose whether you want an IAM role for running the canary or use any of the existing roles.
Bottom Line
These are a few of the set-up steps for some of the features and concepts of AWS CloudWatch. Mastering these easy steps will help you adapt the proficient use of AWS CloudWatch for monitoring the functionality of your apps and services.
Using AWS CloudWatch logs solve many queries and help you perform many actions. You can easily view the logs, search for the errors, filter them and store them with security concerns. Not just that, but users can also query their logs, to sort them, depending upon the dimensions and specific fields. So, make sure you implement them on a practical note to understand its operations.
- Top 20 Questions To Prepare For Certified Kubernetes Administrator Exam - August 16, 2024
- 10 AWS Services to Master for the AWS Developer Associate Exam - August 14, 2024
- Exam Tips for AWS Machine Learning Specialty Certification - August 7, 2024
- Best 15+ AWS Developer Associate hands-on labs in 2024 - July 24, 2024
- Containers vs Virtual Machines: Differences You Should Know - June 24, 2024
- Databricks Launched World’s Most Capable Large Language Model (LLM) - April 26, 2024
- What are the storage options available in Microsoft Azure? - March 14, 2024
- User’s Guide to Getting Started with Google Kubernetes Engine - March 1, 2024