AWS CloudWatch is an observability and monitoring service by Amazon. It is particularly brought into action for the DevOps engineers, SREs, IT Managers, and usual developers to keep track of actionable insights for application monitoring. Apart from that, it is also used for responding to changes within the system performances and resource utilization.
AWS CloudWatch has the potential to collect the data as metrics, events, and logs. All the operational and monitoring data collected by CloudWatch are of the apps, services, and resources running over AWS. There is more to this service that has helped developers up their game. And, this article is all about enhancing your knowledge upon all of the core aspects of it.
The Functionality of AWS CloudWatch
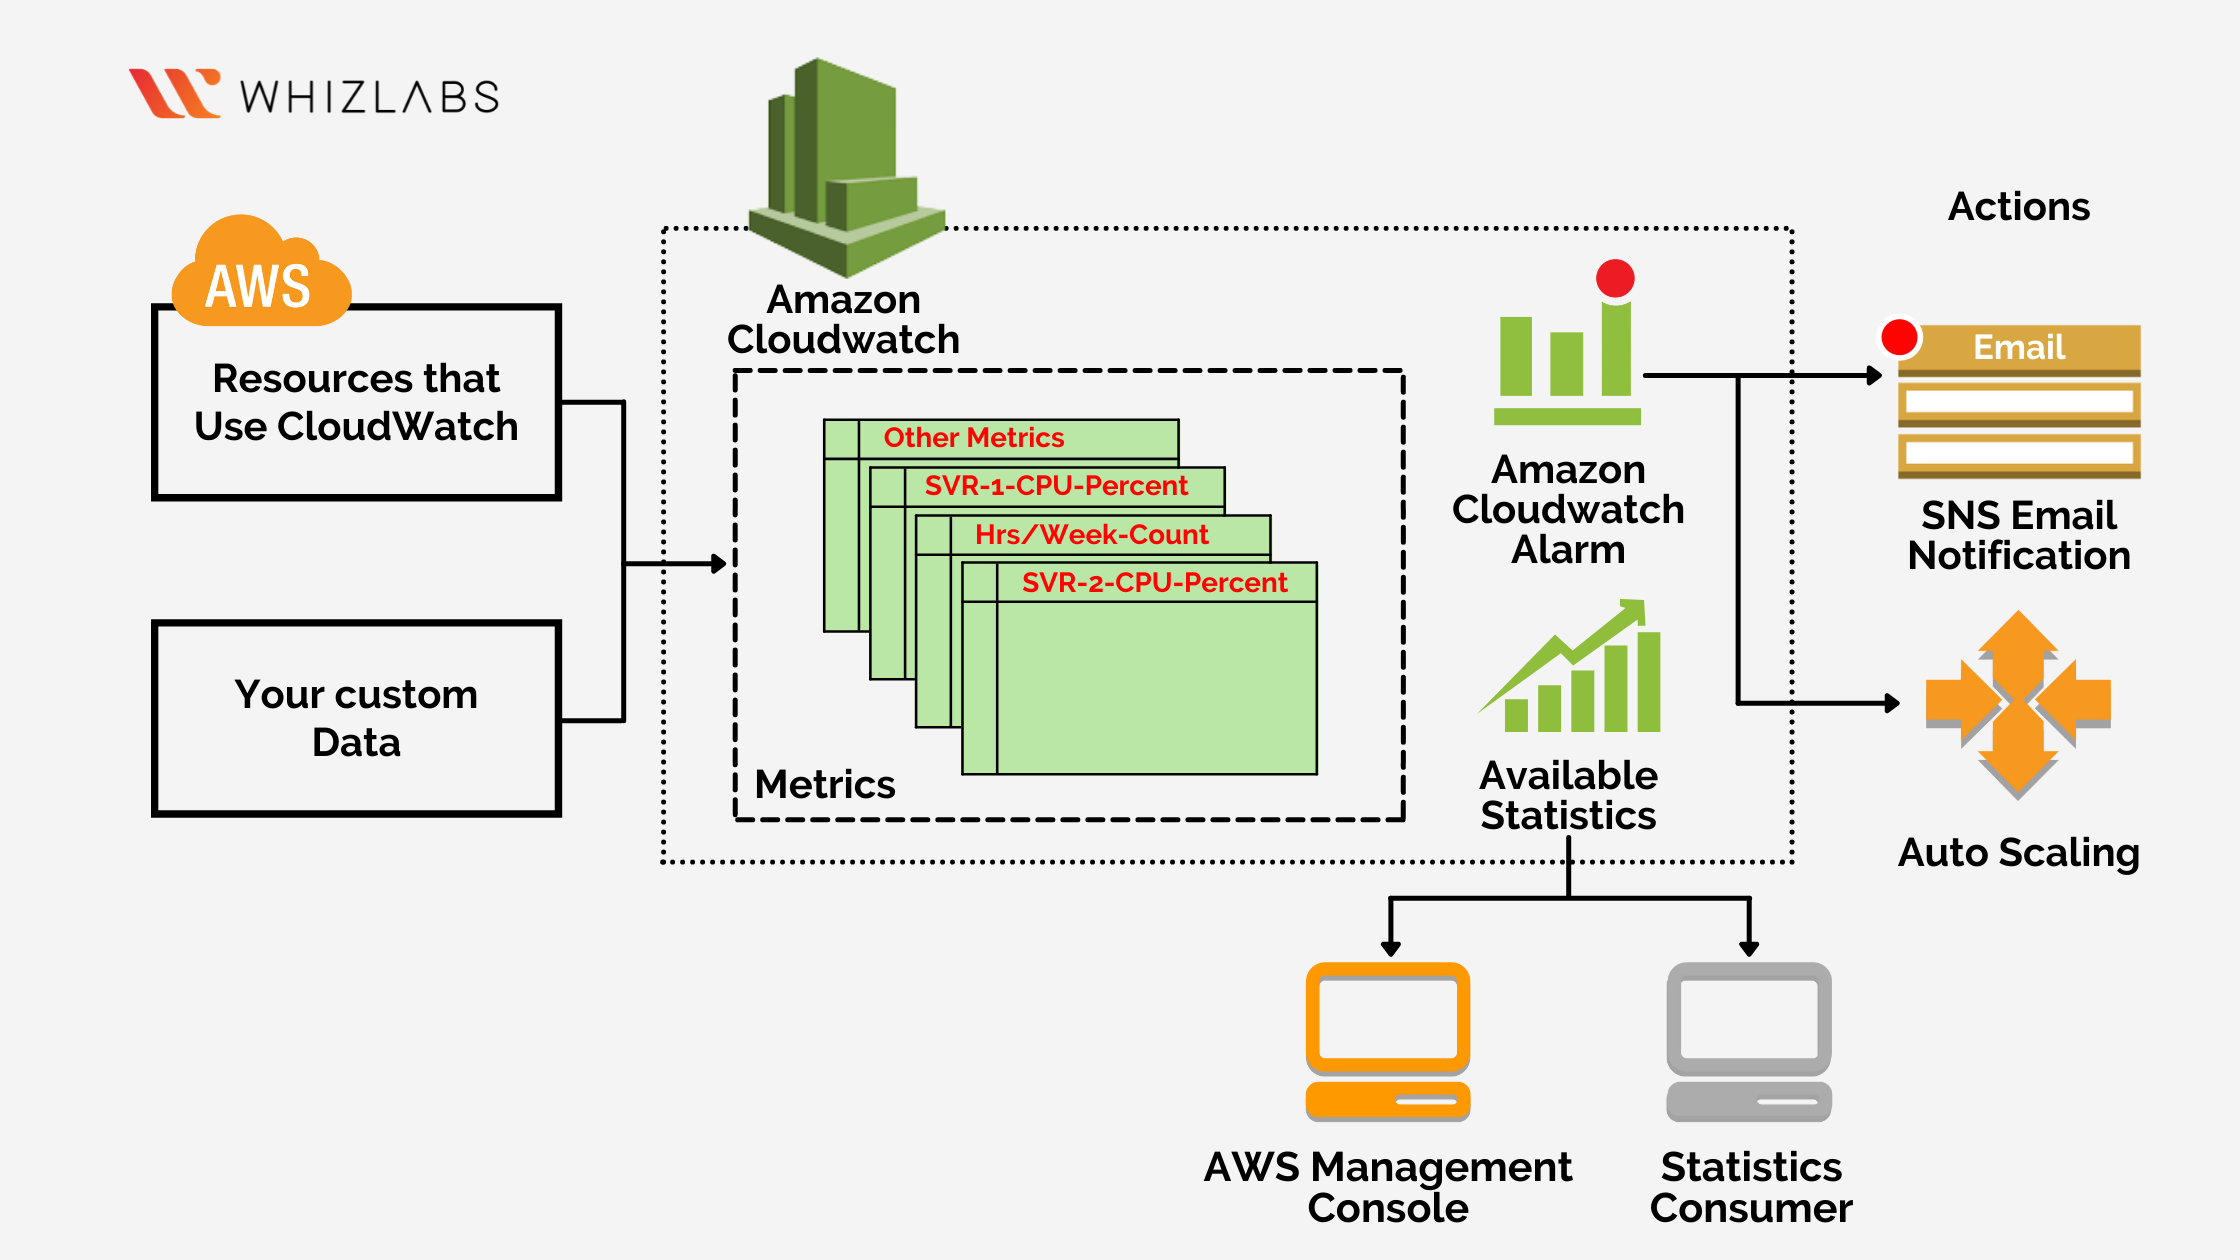
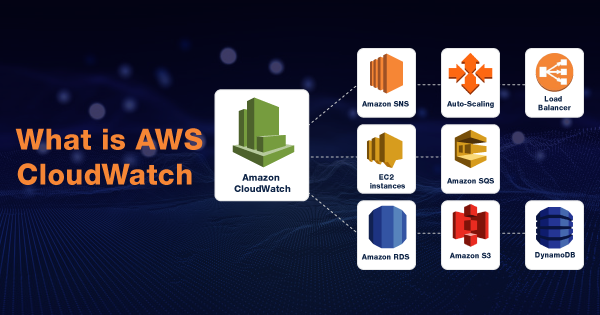
In better terms, AWS CloudWatch is a repository of metrics! Amazon EC2 puts up the metrics into the repository for retrieving statistics based upon the metrics. Developers can use such metrics and statistics to form a graphical representation within the CloudWatch console.
Along with that, AWS CloudWatch allows you to implement alarming actions for starting, stopping, and terminating the EC2 instance if a criterion is met. Apart from that, developers can also create alarms for initiating Amazon SNS and Amazon EC2 auto-scaling actions for you.
AWS CloudWatch is proficient in monitoring the resources of the service of AWS that involves Amazon RDS DB instances, Amazon DynamoDB tables, and Amazon EC2 instances. Apart from that, it also helps to monitor all of the custom metrics that are generated by your services and applications. Any log files that your apps generate can also be monitored within the AWS CloudWatch console.
With this service, you can ensure that resource utilization, operational health, and application performance visibility are expanded and tracked seamlessly. These insights are responsible for maintaining a smooth run for your applications over the AWS environment.
How to Monitor AWS Resources Using AWS CloudWatch?
Monitoring the instances with the help of AWS CloudWatch involves the concepts of collecting and processing the raw data from EC2 into real-time and readable metrics. All of these statistics measured with the help of CloudWatch are recorded for around 15 months. It allows you to get a better insight into how your web app is performing over time.
Amazon EC2 sends the metric data or insight to AWS CloudWatch within periods of 5-minute. If you wish to send the metric data within a 1-minute period, then you need to enable the detailed monitoring aspects upon the instance. The EC2 console will display graphs made out of the raw data of CloudWatch. You can prefer to get data or graphs, depending upon your preference for monitoring them.
The configuration of AWS CloudWatch is ideal for configuration with EC2, which results in two monitoring levels or capabilities that include basic monitoring and detailed monitoring. Basic monitoring comprises 7 pre-select metrics and 3 status-check metrics. These metrics are produced at 5-minute and 1-minute intervals. In addition to that, you do not have to pay any extra fee for the same.
The detailed monitoring is offered with additional charges because it increases the frequency count of producing all of the metrics at 1-minute intervals. The other services that your AWS CloudWatch can automatically monitor include EBS, RDS Database instances. SNS Topics and SQS Queues.
Potential of CloudWatch to Monitor Custom-Metrics
AWS CloudWatch has the potential to monitor all of the custom metrics within the paid tier. It collects all of the data that is produced by the scripts, applications, and services. Not just that, but it can also collect or include almost anything from the application work executions and web page loading times.
For getting started with monitoring the custom metrics, one should use PutMetricData API on priority. It is the most convenient way to commence with this monitoring aspect. But, there are many other tools and apps that are destined to be used for commencing with the purpose of monitoring custom metrics over CloudWatch.
Amazon CloudWatch monitoring of the custom metrics upon the applications allows you to keep track of the operational performances, troubleshoot the issues, spot the trends, and other such optimizations. User activity upon the applications is one of the prominent examples of custom metrics that can be collected and monitored over a period of time for diverse utilizations.
Features and Capabilities of AWS CloudWatch
The best thing about AWS CloudWatch is that it automatically triggers the monitoring aspects of the platform. But its enhanced potential extends up to other capabilities that are highlighted in terms of features. The features of AWS CloudWatch includes:
-
Operational View with the Dashboards
The dashboards within the AWS CloudWatch enable you to create graphs (re-usable) and also visualize the cloud apps and resources in an optimized view. With it, you can graph the logs and metrics side-by-side within a single dashboard for quickly getting the context of it and identifying the problems. Hence, you can easily and effectively reach the root cause of the problem and effectively rectify it at once.
Some of the key metrics that you can visualize, include CPU utilization, memory utilization, capacity comparison, and others. Correlation of the log pattern can also be executed as per the specific metrics, and alarms can also be set for alerting operational and performance issues. System-wide visibility over the dashboard intends to help you observe the operational ability and health of the functions, and it will help you reduce the MTTR (Mean Time to Resolution).
-
Auto Scaling
The Auto Scaling function of the AWS CloudWatch intends to automate the resource planning and capacity aspects. One can make a threshold to alarm on the key metrics and trigger the auto-scaling action automatically. For instance, you have the potential to set up a workflow for auto-scaling and add or remove respective EC2 instances upon the metrics of CPU utilization. Hence, it helps optimize all of the resource costs within CloudWatch.
-
Alarming & Automating Actions on k8, ECS, and EKS Clusters
The container insights within k8 and EKS clusters enable you to alarm the compute metrics for triggering the auto-scaling policies over the Amazon EC2 scaling group. It also offers the ability to reboot, terminate, recover and stop any of the EC2 instances. For the ECS clusters, you can use the compute metrics from your services and tasks directly for the Service Auto Scaling.
-
Compliance & Security
Just like any other AWS service, CloudWatch is also proficient with high-end security and compliance. It is integrated with AWS Identity and Access Management (IAM) for controlling the resources and users with permission of data accessibility. Along with that, CloudWatch has also integrated with FedRamp and PCI compliance for added security. Under it, the data is encrypted at both rest and transfer. In addition to that, you can also use KMS encryption of AWS for encrypting all of the log groups for more enhanced security of data.
These are just a few of the core features of AWS CloudWatch, that enlightens its efficacy. For more added information on all of the features of CloudWatch, refer to this link!
Checking the CloudWatch Logs
Here are the easy and direct steps that you can follow in order to check the CloudWatch logs:
- Access your CloudWatch Console.
- Select the tab ‘Log groups’ from the dedicated navigation window.
- Select the log group that you wish to review and check the streams.
- Pick the name of the log amongst the listed ones within the group.
- Expand the events within that log!
Read more on How to set up AWS CloudWatch Logs?
Pricing of AWS CloudWatch on Different Aspects
AWS CloudWatch is available for developers at no up-front commitment fee. The users need to pay for only what they use within the service, and the billing is usually at the end of every month. But even before you can head to the paid tier of AWS CloudWatch, you can experience the perks of it over the free tier. You need to understand that the pricing of the AWS CloudWatch service is variable, depending upon the regions, and can also change depending upon several factors over time.
Before heading towards the detailed insight into the paid tier, let’s explore the availability of resources within the free tier:
Free Tier of AWS CloudWatch
Most of the Amazon Services, such as S3, Kinesis, EC2, and others, are destined to send valuable metrics for free onto CloudWatch. The process of sending insights is automatic without any external efforts. Most of the applications should be destined to operate seamlessly over these free tier limits. Get an idea about the free tier of AWS by referring to this link!
The perks that you get upon using the free tier of Amazon CloudWatch are as follows:
- Basic monitoring metrics at 5-minute frequency.
- 10 detailed monitoring of the metrics, at 1-minute frequency
- It supports one million API requests. But it is not applicable to GetMetricWidgetImage and GetMetricData.
- You get 3 dashboards with up to 50 metrics every month.
- You get ten metrics for alarms. But you cannot integrate the same for high-resolution scenarios.
- All of the events are inclusive within the free tier, except the custom events.
- You get 5GB space for data ingestion, archiving storage, or storing data that are scanned by the Logs Insights queries.
- You get one contributor insights rule every month.
- You also get 100 canary runs every month.
These are all you get within the free tier of Amazon CloudWatch, which is more than sufficient for most of your applications.
Paid Tier of AWS CloudWatch
As stated above, you only need to pay for what you use over AWS CloudWatch, and nothing up-front. AWS CloudWatch is offering you a price calculator to let you calculate the architecture and CloudWatch cost within a single estimate. But, here are some of the preset amounts that you will be charged within the paid tier.
-
Charges as per the Metrics
- You need to pay $0.30 per metric per month for the first 10,000 metrics.
- For the next 240,000 metrics, you will have to pay $0.10 per metric per month.
- For the next 750,000 metrics, you will have to pay $0.05 per metric per month.
- For over 1,000,000 metrics, you will have to pay $0.02 metric per month.
-
Charges as per the APIs
- For GetInsightRuleReport and GetMetricData, you will have to pay $0.01 for every 1000 metrics that you request.
- For GetMetricWidgetImage API, you will have to pay $0.02 for every 1000 metrics that you request.
- For GetMetricStatistics, PutMetricData, ListDashboards, ListMetrics, DeleteDashboards, and PutDashboard API requests, you will have to pay $0.01 for every 1000 metrics that you request.
-
Charges of the Dashboard
You will be charged around $3.00 for every AWS CloudWatch dashboard that you use. All of it will be billed at the end of every month.
-
Charges as per the Alarms
- For alarms of the standard resolution, you will have to pay $0.10/alarm metric.
- For alarms of high resolution, you will have to pay $0.30/alarm metric.
- For alarms of standard resolution anomaly detection, you will have to pay $0.30/alarm metric.
- For alarms of high-resolution anomaly detection, you will have to pay $0.90/alarm metric.
- For composite alarms, you will have to pay $0.50/alarm metric.
-
Charges as per the Logs
- Data collection or ingestion demands you to pay $0.67/GB.
- Data or archival storage demands you to pay $0.033/GB.
- Data analysis or logs insights query demands you to pay $0.0067/GB data scanned.
-
Charges as per Events
- You need to pay $1.00/million events for custom events.
- You need to pay $1.00/million events for cross-account events.
-
Charges as per Contributor Insights
- The fee for every contributor insight rule is $0.50/rule/month.
- You need to pay $0.027 for every 1 million log events/month that matches the rule.
-
Charges as per Canary Runs
You will be charged $0.0017 for every canary run that you execute over AWS CloudWatch.
Bottom Line
This is all about how AWS CloudWatch has changed the face of monitoring insights and data for determining the app and service performance. AWS is destined to offer proficiency with all of its services, and CloudWatch is yet another marvel offering by the brand.
It gives you accessibility to even turn on or off the detailed monitoring of selected instances. You can list the available metrics within the instances and get statistics for the same. Get hands-on experience to know more about its potential & expertise!
- Top 20 Questions To Prepare For Certified Kubernetes Administrator Exam - August 16, 2024
- 10 AWS Services to Master for the AWS Developer Associate Exam - August 14, 2024
- Exam Tips for AWS Machine Learning Specialty Certification - August 7, 2024
- Best 15+ AWS Developer Associate hands-on labs in 2024 - July 24, 2024
- Containers vs Virtual Machines: Differences You Should Know - June 24, 2024
- Databricks Launched World’s Most Capable Large Language Model (LLM) - April 26, 2024
- What are the storage options available in Microsoft Azure? - March 14, 2024
- User’s Guide to Getting Started with Google Kubernetes Engine - March 1, 2024