Microsoft Power BI is a business intelligence platform designed to help non-technical users gather, analyze, visualize, and share data. It’s user-friendly, especially for those familiar with Excel, and its tight integration with other Microsoft tools makes it a versatile self-service tool that doesn’t require extensive training.
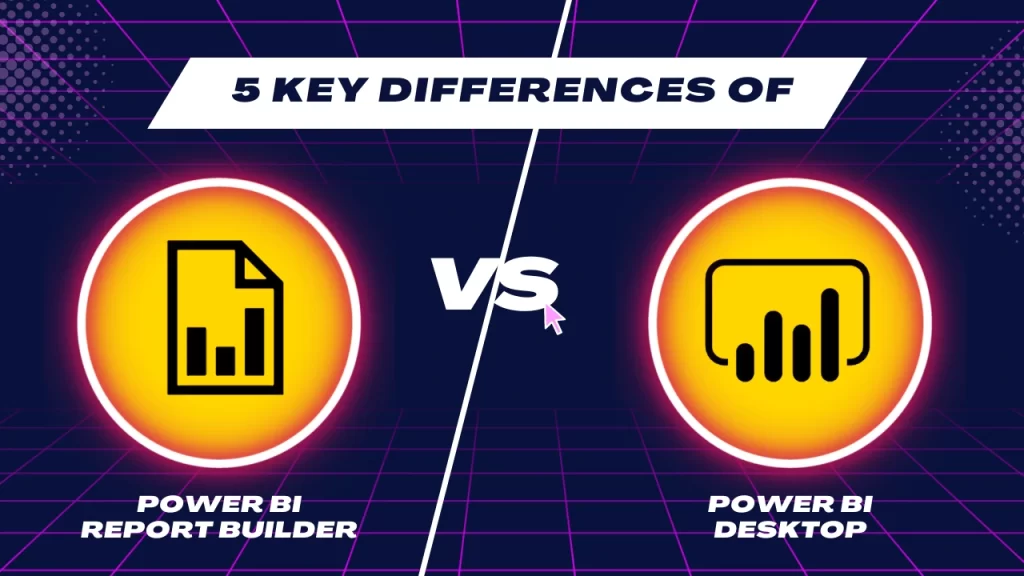
In this blog post, we’ll conduct a Power BI comparison between two frequently utilized tools within the Power BI suite such as Power BI Report Builder and Power BI Desktop. Our goal is to assist you in determining which tool aligns best with your specific reporting needs.
Let’s dive in!
Overview of Microsoft Power BI
Power BI in Microsoft Power BI certification is a potent tool for business intelligence that offers ways to create and distribute interactive reports and dashboards. Nevertheless, the array of tools it offers can make it confusing to select the right one for your particular needs.
Users can get Power BI on their Windows 10 computers as Power BI Desktop, or they can use mobile apps on Windows, Android, and iOS devices. For companies that need to keep their data and reports on their servers, there’s Power BI Report Server. To use this version, you’ll need a special version of the desktop app called Power BI Desktop for Power BI Report Server.
Microsoft Power BI Desktop Vs. Power BI Report Builder: Definition
Even though both tools fall under the category of Power BI, they perform different operations as listed below:
Power BI Desktop
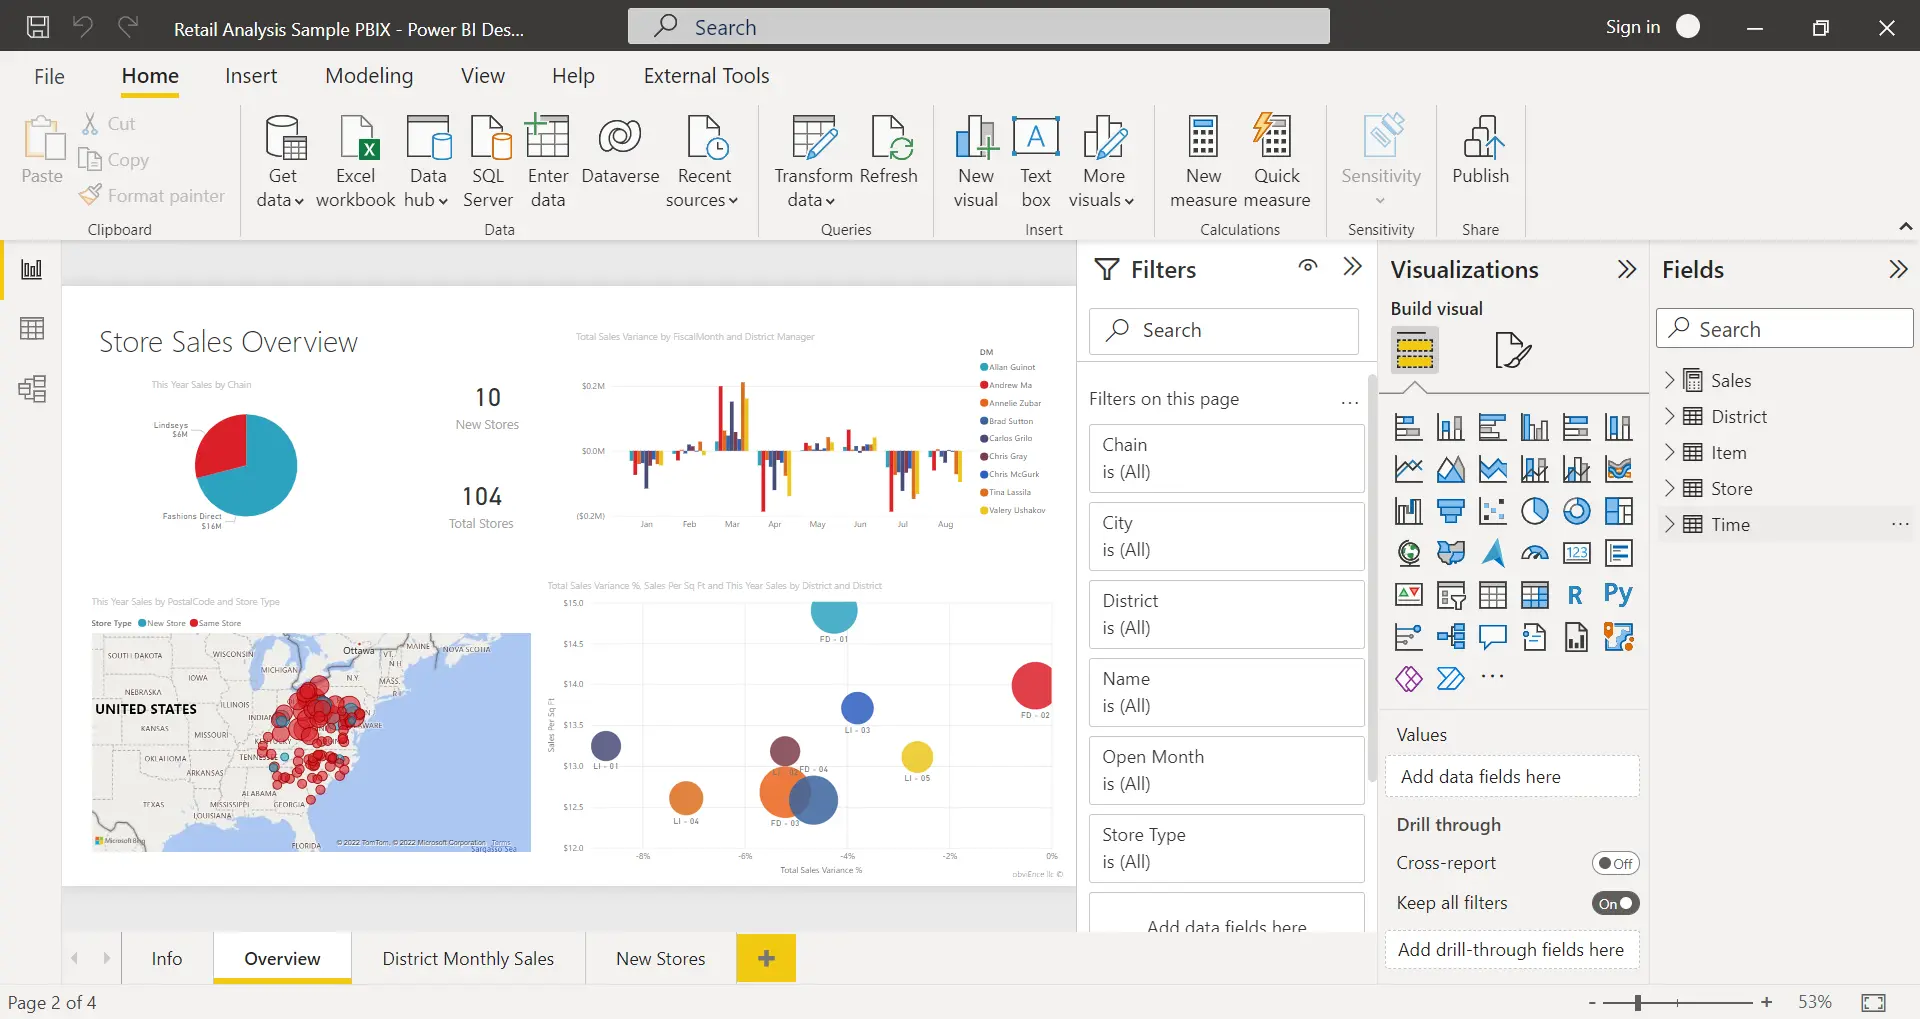
Power BI Desktop is a vital element within the Microsoft Business Intelligence ecosystem. It helps users to effortlessly import, export, and generate reports from complex datasets originating from various data origins. It has come up with spell-bound reporting features to make the analytics process flexible. However, it cannot create a specific type of report called a “paginated report.” Paginated reports are designed for easy export or printing.
The no-cost version of Power BI grants users the capability to share data, create real-time reports, and helps to disseminate them across the web. By upgrading to the Pro edition of Power BI, users gain the ability to effortlessly share these reports or dashboards with colleagues and stakeholders and also they benefit from advanced analytics without causing any significant time overhead.
Furthermore, it boasts support for Power Query and Power Editor, providing it with a distinct advantage over alternative Business Intelligence tools. You can become a master in Power BI Desktop and Power BI Desktop Builder by taking the PL-300 Certification.
Power BI Desktop latest version
Microsoft Power BI Desktop is designed for individuals seeking to extract valuable business insights through data visualization. On the other hand, Microsoft Power BI Pro represents the comprehensive edition, granting users unrestricted capabilities for reporting, sharing, and accessing reports.
Power BI Report Builder
Before answering this question, it’s essential to grasp the concept of a paginated report. It is nothing but a structured, table-based report designed to neatly fit on a page, following the precise format defined by the developer. The tool that empowers users to create paginated reports in the Power BI ecosystem is known as Power BI Report Builder.
Without Report Builder, you won’t be able to generate paginated reports or make edits to existing ones within the Power Platform environment. Report Builder exclusively works with .rdl (report definition language) files. Power BI Report Builder is available for free installation and use on your local machine. You can publish paginated reports to your workspace such as “My Workspace” as long as you have a Microsoft account. However, if you wish to publish paginated reports to other workspaces, you’ll need a Power BI Pro or Premium Per User (PPU) license.
Microsoft Power BI Desktop Vs. Power BI Report Builder: Key Differences
Power BI Desktop and Power BI Report Builder have some important distinctions:
Power BI Report Builder is a separate tool designed primarily for Paginated Reports. It doesn’t support Data Modeling, DAX calculations, or interactive visuals. Report Builder’s main purpose is to offer a static view of current data to stakeholders.
On the other hand, Power BI Desktop is an interactive reporting tool that excels in data modeling and creating complex formulas for in-depth data analysis.
To know which is better, we have to do a comparison based on certain aspects. So, here are comparative study made between the Power BI desktop and Power BI Report Builder.
| Aspect | Power BI Report Builder | Power BI Desktop |
| Type | web-based tool | Windows-based application |
| Data Sources | Supports various sources like Excel, SQL Server, Oracle, etc. | Offers advanced data modeling features like table relationships, data transformations, and DAX formulas. |
| Visuals and Interactivity | Provide basic visuals (tables, matrices, charts) with limited interactivity. | Offers a broad range of visuals and allows custom visual creation from the Power BI marketplace. Supports advanced interactivity (e.g., drill-down, drill-through, cross-filtering). |
| Reporting Types | Designed for paginated reports (optimized for printing or PDFs). | Provides flexibility to create various report types: interactive dashboard creation, paginated reports, and mobile reports. |
| Ease of Use | User-friendly drag-and-drop interface for basic reports. | Requires advanced skills in data modeling, calculations, and complex report design. |
The real thing is that both Power BI Report Builder and Power BI Desktop are robust tools for designing reports and dashboards. The decision between them lies in your distinct reporting needs, your proficiency in working with data structures, and the degree of interaction you require.
Also Read : A Beginner’s Guide to Power BI Report Builder – 2023
Actually, these two tools serve distinct purposes. Power BI Report Builder is used for creating and sharing paginated reports, while Power BI Desktop is employed for designing and publishing visual charts and reports. If your goal is to report generation for printing or generating PDFs, then Report Builder will be an ideal choice.
However, if you aim to create dynamic dashboards, work on data connections, and employ advanced visual elements, then Power BI Desktop becomes the preferred one.
Power BI Desktop Vs. Power BI Report Builder: Use Cases
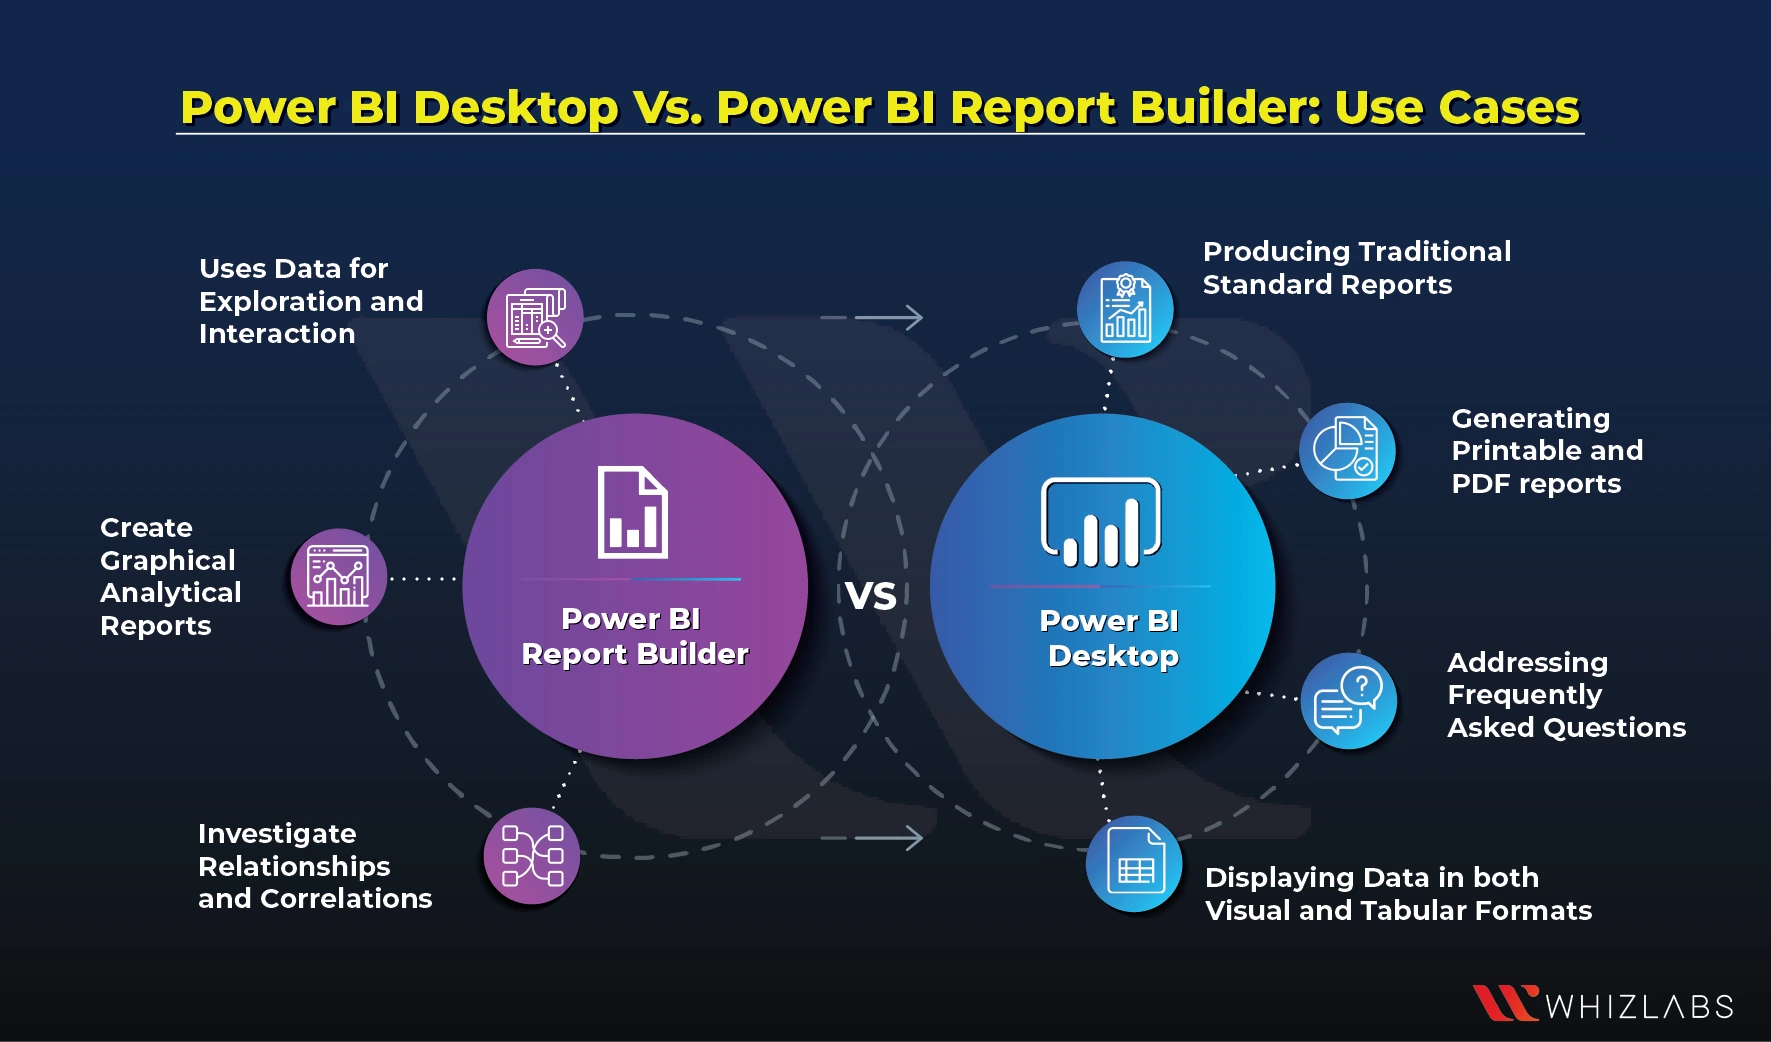
The use cases of the Power BI Desktop and Power BI Report Builder have been listed below:
Power BI Report Builder -Use cases
- Uses data for exploration and interaction.
- Create graphical analytical reports.
- Investigate relationships and correlations.
Power BI Desktop-Use cases
- Producing traditional standard reports.
- Generating printable and PDF reports.
- Displaying data in both visual and tabular formats.
- Addressing frequently asked questions.
Power BI Desktop Vs. Power BI Report Builder: Limitations
Power BI Report Builder
- It’s not easy to connect to certain types of data sources directly.
- To connect to data stored on your own computers (on-premises), you need special tools called data gateways.
- People can only share certain types of reports with others if they have a specific type of license.
- Making reports work smoothly with some types of data sources can be tricky.
Power BI Desktop
- Power BI Desktop doesn’t offer the option to privately publish your reports and dashboards on the web.
- Both versions of Power BI Desktop provide up to 8 data refreshes per day, each separated by at least 30 minutes.
- Power BI Desktop lacks integration with Office 365 applications, preventing the export of reports to CSV or PPTX formats.
FAQs
What are the different types of Microsoft Power BI desktops?
Power BI Desktop comes in different types, and there are various types of Power BI licenses available. To put it simply, there are three primary categories of Power BI per-user licenses and they are Desktop (which is free), Pro, and Premium.
What are the three different views of the Power BI desktop?
Power BI Desktop offers three primary views accessible through icons on the left side of the interface: Report, Data, and Model. A yellow bar on the left indicates the current view, and you can switch between views by selecting the respective icons.
What are the five types of Microsoft Power BI reports?
The five common types of Power BI reports are:
- Sales analysis reports
- Financial analysis reports
- HR analytics reports
- Customer profitability reports
- Digital marketing reports
Is it possible to use DAX in Power BI Report Builder?
No, it is not possible to use the DAX in the Microsoft Power BI Report Builder directly. Instead, it uses the paginated reports.DAX is a language primarily associated with Power BI Desktop and Power Pivot in Excel and it is mainly used for data modeling, interactive reports, and dashboards.
Conclusion
Hope you have understood Microsoft Power BI, Power BI Builder, and Power BI Desktop and the differences that exist between the Power BI Desktop and Power BI Report Builder. By analyzing those comparative data, you can choose the respective tools as per your needs.
You can experiment with the chosen tool in a a real-time manner with the help of Power BI hands-on labs, and sandboxes. If you want to further get into Microsoft Power BI, you can utilize the preparation materials like PL-300 Study guides, PL-300 practice tests, and so on. If you have any questions on this blog post, feel free to comment to us!
- AWS Security Specialists: Essential in Modern Cybersecurity - August 16, 2024
- Cloud Developer Tools Showdown: AWS vs Azure vs GCP - August 14, 2024
- Master AWS Lambda and API Gateway for Application Development - August 6, 2024
- Benefits of AWS Developer Associate Certification which Can Boost Your Career - July 24, 2024
- Preparation Guide on Datadog Fundamentals Certification - July 17, 2024
- What is DLP in Power Automate? - June 5, 2024
- Top Data Engineering Certifications in 2024 - May 30, 2024
- How Difficult is Google Cloud DevOps Engineer Certification? - May 29, 2024