
Azure Monitor is a service by Microsoft that has the potential to enhance the performance and availability of services and applications. With Azure Monitor, you can intend to collect, analyze and act upon the metrics collected from the cloud and the on-premise environments. With this collective information, you will get an idea of how the applications within Azure performs. Hence, you can identify the issues that affect those applications.
To be precise, Azure Monitor is used for detecting and diagnosing the issues across dependencies and applications. You can do this with the help of Application Insights. To know more about Application Insights, log onto the link! Not just that, but you can also correlate the infrastructure issues, track the monitoring data, support scaling operations, create visualizations, and much more. There is a dedicated service aspect within Azure Monitor to help you keep an eye on everything that is going on within the premises.
There is more to Azure Monitoring that you are deprived of to date. So, if you intend to use Azure Monitor for tracking the performance of your services and applications, then this article is for you! Follow on till the end to know every important feature and attribute of Azure Monitor.
Exam AZ-400: Microsoft Azure DevOps Solutions is intended for the DevOps professionals who have already received the badge of Azure Developer Associate or Azure Administrator Associate. Check out Whizlabs Free Tests Now!
In-Depth Working Insight Of Azure Monitor
Every bit of data collected by Azure Monitor is categorized into two types, which include Metrics and Logs. Metrics are specified as the numerical values that describe some integral progress of any system, limited within time. Metrics are lightweight statistics that are important to elaborate the real-time scenarios. Logs, on the other hand, are a collection of different types of data that are then combined to form records. Each of the records is set with a different type of property.
Telemetry, including traces and events, is stored in the form of logs, along with the performance data. It is done to ensure that all can be combined together for a detailed analysis. The log data that is obtained by Azure Monitoring can then be carried out for analysis with the queries. It will speed up the process of retrieving, consolidating, and analyzing the data collected. Moving on, you can create & test the queries with the help of Log Analytics. You will get to access it over your Azure Portal. You get the option to either analyze the data directly after you collect it or save the queries for using them with visualizations.
Azure Monitor has the potential to collect data from diverse sources. Whether you want to collect insight from your OS, application, or relying upon services, Azure Monitor can help you out with the same. There are certain tiers from which it collects data. The tiers include Application Monitoring data, Guest OS Monitoring Data, Azure Subscription Monitoring Data, Azure Resource Monitoring Data, and Azure Tenant Monitoring Data.
Application monitoring data is the tier from which Azure Monitoring collects data upon the functionality of the code and performance, irrespective of the platform. The Guest OS Monitoring data tier is about the collection of OS data upon which the app is currently running. It doesn’t matter whether your app is running over Azure or any other cloud; Azure Monitor will help collect that data for you. Similarly, the resource, subscription, and tenant monitoring data tiers intend to collect resource operation, subscription management & operation, and tenant-level service operation data within Azure, respectively.
AZ-304: Azure Architect Design exam is intended for the Solution Architects. Prepare with Azure AZ-303 training course and get ready to become a Microsoft Certified Azure Architect. Check out Whizlabs Free Tests Now!
Right after you create the Azure subscription and add resources onto it, Azure Monitor will begin collecting data for the same. Whether you add up Virtual Machines or web apps, Microsoft Azure Monitoring will continue doing its job all the time. The activity logs will record the creation and modification of the resources, and the metrics will give an insight into the performance of resources. You can go ahead and enable the diagnostics for collecting more data, replicating the insights into the internal operation of all of those resources.
You can then add a respective agent for computing resources to collect important telemetry from the guest OS. With Application Insights, you can enable monitoring the application for collecting page views, exceptions, application requests, and others. Moving on, you can also check upon the availability of the application by creating an availability test for tracking the user traffic.
Know About Different Insights Within Azure Monitor
Monitoring data is quite useful, as it has the potential to increase the visibility into core operations of the computing environment. Insights play a major role in offering customization in terms of enhancing the monitoring experience for select Azure Services. You can enable these insights with minimalistic configuration and track the critical resources. The insights are as follows:
1. Application Insights
Application Insights intend to monitor the performance, availability, and usage of web apps. It doesn’t matter whether that data is hosted on-premises or over the cloud. Application Insights will help you obtain and monitor them. It uses the data analysis platform within Azure Monitor to provide deep insights into the app operations. It will help you diagnose the errors as soon as possible, without the necessity of waiting for a user to report such flaws. There are connection points within Application Insights that connect to different tools for supporting the associated DevOps processes.
2. Container Insights
Container insights intend to offer you monitoring capability of the container workloads. The container workloads are usually integrated for managing the Kubernetes clusters hosted by the Azure Kubernetes Service (AKS). Performance visibility is possible by the container insights, with the help of collecting the metrics from nodes, controllers, and containers. You just have to enable monitoring of the Kubernetes clusters, and all of the logs and metrics will be collected automatically for you to monitor them.
3. Virtual Machines Insights
VM Insights, as the name suggests, is for monitoring the Virtual Machines. It helps you to analyze the health and performance of VMs associated with Linux and Windows. Along with that, enabling these insights, you can also identify the processes and dependencies upon external processes of the VMs. This solution offers support for monitoring the VM’s performance, whether hosted on-premise or over the cloud.
4. Visualization of the Monitoring Data
Azure Monitoring perks also have a scope of putting up tables and charts, with effective tools for summing up all of the data in a presentable manner. In the form of tables and charts, you can present the insight to different audiences. Azure Monitor consists of ideal features that help it visualize the monitoring data and use other associated Azure services for publishing the same to diverse audiences. The services include:
5. Azure Dashboards
Azure Dashboards have the potential to combine different data into a single structure within the portal. There is an option for you to share this dashboard with other users as well. You can now add the output of any of the metrics or log query onto the Azure Dashboard. It means that you can combine the metrics graph, activity log tables, and Application Onsight chart altogether, within a single pane, for ideal visualization.

6. Power BI
Power BI is yet another powerful business analytics service that offers quite interactive visualizations across diverse sources of data. Power Bi is one of the most efficient services to make data available for others, irrespective of whether they are within or outside the organization. You have access to control Power BI for automatic importing of the log data from Azure Monitor. Hence it can take advantage of these business analytic visualizations.
7. Workbooks
“Workbooks” is offering a canvas for users to create visual reports within the portal for rich data analysis. With the use of it, you can tap into the multiple data resources across Azure. You can all of those data resources to combine the insights to create interactive experiences. You can also create your own templates over Workbooks and use the data of Azure Monitor for preparing visualizations.
How To Create A Metrics Chart Within Azure Monitor?
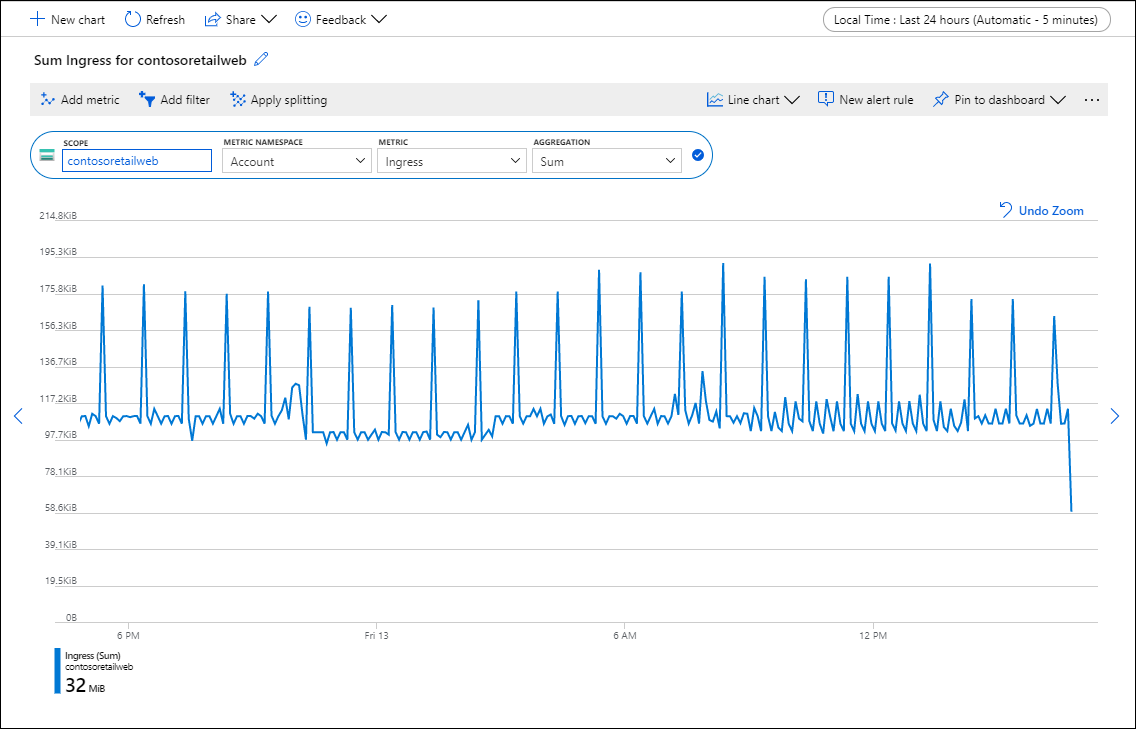
For creating a metrics chart within Azure Monitor, you need to use Metrics Explorer. It is the feature within the Azure Portal that will allow you to carry out the process of creating metrics charts with accurate values. Not just that, but you will also be able to visually co-relate the trends, investigate the spikes, and keep track of the dips within those values. With the help of Metrics Explorer, you need to investigate the health & utilization of the Azure resources for plotting charts from the available or custom metrics. Follow onto these steps to create your metrics chart within the Azure Monitor:
- First step first, log onto the Azure Portal with your credentials!
- Now, look for the Metrics Explorer, within the Azure Monitor menu or from the resource’s menu of the portal.
- Select ‘Metrics’ from the Azure Monitor menu, or go to the ‘Monitoring’ section of the resource menu.
- Select the ideal ‘Scope.’ It is the resource for which you are willing to obtain the metrics.
- Now you will have to select a ‘Namespace,’ in case the scope you preferred has more than one namespace.
- Now, choose one metric from the list of all of the metrics within the list of selected scope & namespace.
- You can now change the ‘Aggregation’ of the metric. (Optional).
- Now, go ahead and ‘Add Metric’ button to create your metric chart. In case you want to add multiple metrics onto the same chart, then you will have to repeat all of the steps. Click on the ‘New Chart’ button for the same!
What Is Continuous Monitoring with Azure Monitor?
Continuous monitoring refers to the technology or process essential for incorporating the monitoring aspects across each of the IT operations and DevOps phase lifecycles. Moreover, it will help you ensure the performance, reliability, and health aspects of the application with ideal tracking and monitoring solution.
Continuous monitoring is built over the collective concept of Continuous Deployment and Continuous Integration. It helps you deliver and develop the software in a more fast and reliable manner. Hence, it will offer a continuous value to the users. If you intend to gain optimal observability upon the complete environment, then you must enable the monitoring potential of all of the web services and applications. Hence it will allow easy visualization of the end-to-end connections and transactions across all of the components.
You get the ability to enable monitoring of the complete infrastructure and make it reliable. When you enable it for your complete infrastructure, you will get full observability with the potential to discover even the minute causes that are responsible for promoting failures within the application. With Azure Monitor, you can expect to track the performance and health of the entire infrastructure, along with the ideal resources such as containers, storage, network, and VMs.

With Azure Monitor and Continuous Monitoring, you will get activity logs, diagnostic logs, and platform metrics automatically. It will help you enable deep monitoring for VMs and their insights. Not just that, but you can also use Resource Manager Templates for enabling monitoring and configuration alerts for setting up the resources. Moreover, make use of the Azure Policy to implement rules upon the resources for ensuring that the resources remain compliant with service level agreements and corporate standards.
Final Words
These are some of the things you need to keep in mind while you implement Azure Monitoring upon your application performance monitoring aspects. It is an impactful service that blends with all of the other Azure resources and services to collect, analyze and act upon the data for identifying and rectifying errors, even before they get reported. Azure Monitor also allows you to create different actionable alerts specified with the type of actions. You can go ahead and prepare the workbooks and dashboards to implement visualization onto the metrics.
Microsoft Azure Monitoring can help streamline your performance tracking and data monitoring aspects. So, it is important for you to consider the fundamentals of this service concept and utilize it to adapt its efficacy for determining the loopholes within the applications or service and rectify them beforehand.
- Top 20 Questions To Prepare For Certified Kubernetes Administrator Exam - August 16, 2024
- 10 AWS Services to Master for the AWS Developer Associate Exam - August 14, 2024
- Exam Tips for AWS Machine Learning Specialty Certification - August 7, 2024
- Best 15+ AWS Developer Associate hands-on labs in 2024 - July 24, 2024
- Containers vs Virtual Machines: Differences You Should Know - June 24, 2024
- Databricks Launched World’s Most Capable Large Language Model (LLM) - April 26, 2024
- What are the storage options available in Microsoft Azure? - March 14, 2024
- User’s Guide to Getting Started with Google Kubernetes Engine - March 1, 2024