
In the ever-growing data-centric landscape, grasping solid data visualization and analytics skills via tools like Power BI can be a great asset.
Data visualization plays a pivotal role in the realm of business intelligence, offering a powerful means of transforming complex data into actionable insights. By visually representing data through charts, graphs, and interactive dashboards, data visualization enables businesses to comprehend and communicate information more effectively. Getting PL-300 certification can nurture you with both presenting and analyzing data-driven insights.
The given blog explores the basics of data visualization in Power BI, what exists, use cases, and the benefits of data visualization.
Let’s dig in!
Data Visualization in the Context of Power BI
Business intelligence aims to transform collected data into actionable information that fulfills operational and strategic objectives while supporting decision-making processes. To achieve this, organizations recognize the need to offer various user-friendly methods for interpreting and exploring data without requiring technical expertise. Data visualization tools play a significant role in achieving this goal.
Modern analytics solutions provide self-service BI reporting capabilities through data visualization tools. These tools allow companies to present quantitative data in a data-driven, easily digestible, and user-friendly manner. By utilizing data visualization, organizations can effectively display and share key performance indicators (KPIs) and business metrics, enabling customers and end-users to quickly grasp the most important figures.
Data visualization tools are increasingly combined with data storytelling narratives to provide deeper context and meaning to the presented information. This approach enhances the interactive nature of delivering day-to-day KPIs and business metrics, enabling a clearer understanding of business performance, objectives, and potential insights.
Across various industries such as retail, science, finance, and healthcare, enterprises and software companies adopt business intelligence solutions to break down their data and provide a comprehensive understanding of their business. Data visualization tools are a crucial component in achieving this goal by effectively visualizing data, facilitating analysis, and uncovering valuable insights.
Types of data visualization
In the traditional data visualization method, simple forms of data visualization types such as pie charts, tables, and line graphs were employed instead of text-based reports. As the Power BI tools become the vast majority of usage, analytical solutions aid some of the features to visualize the complex datasets and to carry out the data visualization in a real-time manner.
Also Read : What is Data Visualization?
Nowadays, there are many data visualization types available and they are used to show and represent the information in an engaged way with the apt output that is dependent on analytics solutions.
Here is a list of different types of visualizations commonly used in data analysis and reporting:
- Area Chart: This shows the relationship between variables using filled areas under a line.
- Bar Chart: This represents data using rectangular bars, with the length or height of each bar proportional to the data it represents.
- Column Chart: Its operations are similar to bar charts, it can be built with the usage of vertical columns instead of horizontal bars.
- Image Map: An image-based interactive visualization where different areas of the image act as hotspots that provide information when clicked or hovered over.
- Meter Chart: Visualizes a single value within a specified range, often used to represent progress or performance.
- Numeric Display: Presents a single numeric value or multiple values in a visually prominent format.
- Pie Chart: Displays data as slices of a circular pie, with each slice representing a proportion of the whole.
- Scatter Plot: Plots individual data points as dots on a graph, useful for visualizing relationships or correlations between variables.
- Stacked Bar Chart: This represents multiple categories or series stacked on top of each other, displaying the composition of each category.
- Treemap: Hierarchical visualization that partitions a rectangular space into nested rectangles, with each rectangle representing a hierarchical level and its size representing a value or dimension.
Selection of the apt visualization that can deliver the intent of the data in an effective way is significant to ensure that the end users can be able to understand, interpret, and act on it.
Benefits of Data visualization
Analyse Trends and Patterns
Data visualization offers a significant advantage by enabling the identification of trends and patterns that may not be apparent when examining raw data alone. This is attributed to our brain’s innate ability to process information visually.
By presenting data in visual formats, our cognitive abilities are better equipped to perceive and understand relationships, correlations, and patterns within the data. Thus, data visualization enhances our ability to uncover valuable insights that might remain hidden when solely relying on numerical data analysis.
Better decision making
Data visualization offers a valuable advantage in facilitating better decision-making by providing insights that may not be readily accessible through other means. For instance, when faced with the task of selecting a product to sell in an online store, relying solely on a table of sales figures may not offer a comprehensive understanding of customer preferences.
By employing data visualization techniques, such as creating charts, graphs, or heatmaps, you can visually represent the sales data and gain a clearer picture of which products are most popular among your customers. Visualizing the data allows you to identify trends, patterns, and correlations that might not be evident when examining raw numbers.
Easy to use
Data visualization is not only a powerful tool but also user-friendly and accessible. With the availability of various software programs like Power BI, Tableau, and Apache Superset, creating captivating visualizations has become incredibly convenient. These tools empower users to generate visually stunning representations of data with just a few clicks.
Whether you are a beginner or an experienced data analyst, the ease of use and the availability of learning resources enable anyone to harness the power of data visualization. It opens up new opportunities for individuals and organizations to effectively communicate insights, gain a deeper understanding of data, and make data-driven decisions without requiring extensive prior knowledge or expertise.
Data visualization use cases
Here are some common use cases of data visualization:
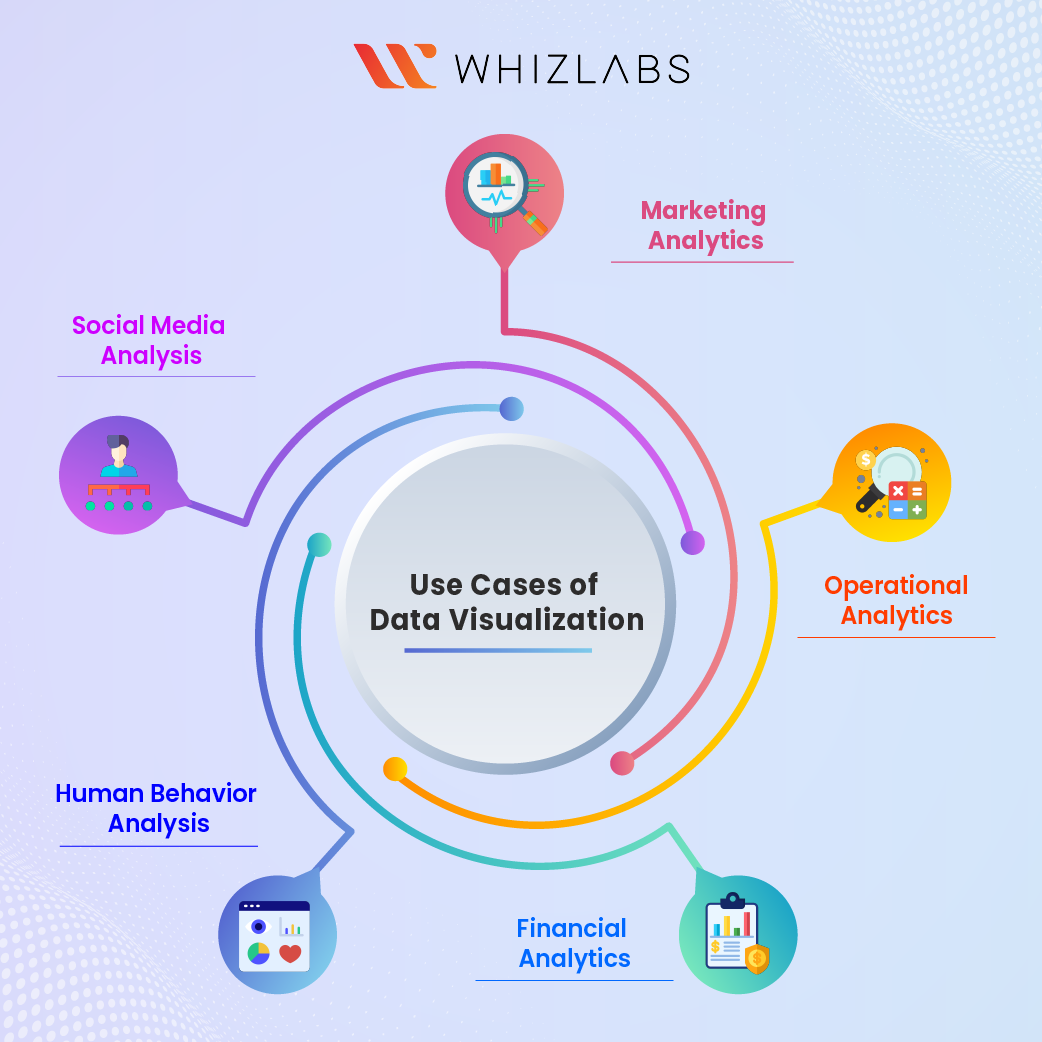
Marketing Analytics
There is a pivotal role of data visualization in this sector. By the data visualization process relevant to the website traffic, marketing campaigns, and sales activity, the business can gain insights about the things which is going to work and which are not. This kind of data can be used for the selection of effective marketing strategies and resource allocation. In addition, past performance can help the business to go with the future trends.
Operational Analytics
Operational analytics through data visualization allows businesses to have a real-time understanding of their performance across different operational areas. This includes tracking metrics such as sales, customer satisfaction, inventory levels, production efficiency, and more.
Visualization tools help in presenting these metrics clearly and intuitively, enabling stakeholders to quickly grasp the current state of operations and make informed decisions. Moreover, data visualization in operational analytics can provide benchmarks for comparison against similar businesses or industry averages. By comparing performance metrics with industry standards, organizations can identify their competitive position and areas where they need to catch up or excel.
Financial Analytics
Data visualization is widely utilized in financial analytics to monitor and analyze crucial financial metrics such as income, expenses, profitability, and cash flow. By visually representing this data, businesses can enhance the comprehension of their financial health and make well-informed decisions regarding resource allocation.
Furthermore, analyzing financial data over time using visualizations facilitates the identification of trends and the early detection of potential issues, allowing for proactive measures to be taken.
Human behavior analysis
Data visualization plays a major role in the identification of customer segmentations, correlations, and trends that are hidden in the tabular form. By acknowledging the end user’s behavior, the business can make effective decisions on marketing, operations, and product development.
Social media analysis
The vast amount of unstructured data in the form of text comments generated on social media platforms can be overwhelming to analyze manually.
Data visualization provides a valuable solution by helping to extract meaning from this data and uncover patterns and trends in what people are saying. By visualizing the data, businesses can gain valuable insights into customer sentiment, preferences, and opinions.
Analyzing social media data through visualization allows companies to understand how customers perceive their products or services. This understanding can drive improvements in product development, customer experience, and overall business strategy.
By identifying recurring themes, sentiments, or issues expressed in social media comments, companies can make informed decisions to enhance their offerings and address customer concerns.
Data visualization pitfalls
If you want to make the visuals for the analytics, you have to consider some of the snags that exist with it. Using the visualization tool is not a big deal. Some concerns emerge while making the visualization process. And they are:
| Concerns | Description |
| Concerns during data preparation | The dataset preparation stage in data processing requires careful consideration of assumptions, as it influences various aspects of software development. This includes determining the required data, identifying suitable sources, and deciding whether data transformation and multiple formats are necessary. To mitigate potential pitfalls, conducting thorough testing throughout the data processing stages is essential.
In data visualization, it is crucial to test assumptions that directly impact the visualization process, such as initial data types, chosen sources, data sourcing methods (querying, constant updating, ad hoc reporting), and the architecture of the database or data warehouse. A domain expert, such as an ETL developer, can conduct these tests, while data engineers and data analysts can contribute to the discussion surrounding assumptions. This comprehensive testing approach ensures the accuracy and reliability of the data visualization process. |
| Data visualization concerns | The visualization stage in business intelligence is predominantly influenced by the user rather than being solely driven by technology.
Although business intelligence tools incorporate semi-AI capabilities, it is ultimately the user who determines the format of the visualization and defines the properties of the presented data. This emphasizes the critical role of the user in selecting the appropriate visualization techniques and configuring the visual representation on a canvas. While technology can assist in generating visualizations, the user’s expertise and decision-making are paramount in effectively communicating insights and extracting meaningful information from the data. Some of the concerns during the data visualization such as:
|
FAQs
How does data visualization fit into business intelligence?
Advanced analytics depends on data visualization, which is a component of many business intelligence solutions. It assists people in making sense of the vast amount of information or data produced nowadays. When data is visualized, it is presented graphically as a pie chart, graph, or another kind of visual display.
What functions does data visualization serve?
Data specialists and organizational leaders can utilize the graphic presentations of information created by data visualization analysts. The goal of data visualization is to make vast amounts of information, or “big data,” simple to interpret and utilize to spot trends and anomalies.
What three key objectives should data visualization adopt?
The three basic purposes of data visualization are exploration, monitoring, and explanation. Most visualizations focus on a single objective, while some can concentrate on more than one.
What are the benefits of data visualization in Power BI?
- Unlock Key values
- Identify patterns
- Easy to understand
- More attractive and user-engaged
- Display complex relationships.
Summary
Hope this article covers everything you need to know about data visualization in business intelligence. Enhancing your proficiency in data visualization can significantly enhance your decision-making capabilities, facilitate clear communication of complex information, and enable you to identify valuable trends and patterns in your data.
To acquire these skills, Whizlabs offers Business Intelligence and Visualization Courses designed to empower you in leveraging data effectively with the guidance of expert instructors, hands-on training, and real-world examples. You will gain the knowledge and practical skills necessary to transform raw data into meaningful information that drives business growth and success.
- Top 25 AWS Data Engineer Interview Questions and Answers - May 11, 2024
- What is Azure Synapse Analytics? - April 26, 2024
- AZ-900: Azure Fundamentals Certification Exam Updates - April 26, 2024
- Exam Tips for AWS Data Engineer Associate Certification - April 19, 2024
- Maximizing Cloud Security with AWS Identity and Access Management - April 18, 2024
- A Deep Dive into Google Cloud Database Options - April 16, 2024
- GCP Cloud Engineer vs GCP Cloud Architect: What’s the Difference? - March 22, 2024
- 7 Ways to Double Your Cloud Solutions Architect Role Salary in 12 Months - March 7, 2024