This PL-300(earlier named as DA-100) Certification Exam: Microsoft Power BI Data Analyst certification is for data analysts. This certificate is crucial for you if you use Power BI to create data visualizations. The DA-100 course teaches you to design scalable data models, clean and transform data and present analytic insights.
This set of 25 DA 100 exam questions will cover the important skills measured in the DA-100 Exam such as:
- Prepare the data
- Create a model
- Create Visualization
- Analyze and prepare insights
- Deploy and maintain deliverables
These DA 100 exam questions will give you a very good idea of how the actual exam would look like; you can practice more with our DA-100 practice exam.
Latest Update 2022:
The Exam DA-100 Analyzing Data with Microsoft Power BI has been expired on March 31, 2022 and the name changed to PL-300 Microsoft Power BI Data Analyst.
Microsoft Power BI – DA 100 Exam Questions
Model the data
Q 1. You are interested in creating a measure that will always calculate the total sales for 2020, irrespective of the year selected in any other visual in Power BI. Which of the following is the right way to create such a measure?
A. Total Sales for 2020= CALCULATE(SUM(‘Sales OrderDetails'[Total Price]), YEAR(‘Sales OrderDetails'[orderdate]) = 2020)
B. Total Sales for 2020= SUM(CALCULATE(‘Sales OrderDetails'[Total Price]), YEAR(‘Sales OrderDetails'[orderdate]) = 2020)
C. Total Sales for 2020= TOTAL(SUM(‘Sales OrderDetails'[Total Price]), YEAR(‘Sales OrderDetails'[orderdate]) = 2020)
D. It is not possible to create such a measure.
Correct Answer: A
The CALCULATE function in DAX helps in creating a measure that will override the specific portions of the context that are being utilized to express the correct result. The syntax to use the calculate function is:
CALCULATE(<expression>[, <filter1> [, <filter2> [, …]]])
Where expression represents the expression that is to be evaluated and Filter1, Filter2 are optional and represent the table or Boolean expressions that define filters, or filter modifier functions.
As an example, the following measure can be created for the SALES table that will calculate the revenue for the only products that have a blue color.
Blue Revenue =
CALCULATE(
SUM(Sales[Sales Amount]),
‘Product'[Color] = “Blue”
)
- Option A is correct. CALCULATE function in DAX is used to create a measure that will override the specific portions of the context that are being utilized to express the correct result. As we are interested in calculating the total sales for 2020, we will use the SUM function inside the CALCULATE.
- Option B is incorrect. CALCULATE is the DAX function and SUM should be used inside the CALCULATE. The given expression is not correct syntactically.
- Option C is incorrect. Total is not the function to calculate the total sales. Instead, CALCULATE is the right function to calculate the total sales.
- Option D is incorrect. The expression given in option A is a way to create the required measure.
Q 2. Consider the below-given sample data:
| Date | Day | Month |
| 2021-02-01 | 1 | 2 |
| 2021-02-02 | 2 | 2 |
| 2021-02-03 | 3 | 2 |
| 2021-02-04 | 4 | 2 |
You need to create a calculated column to show the date in a format like this February 01, 2021. Which of the following DAX expression would you use?
A. FORMAT([Date],”M”)|| FORMAT([Date],”D”)|| FORMAT([Date],”Y”)
B. FORMAT([Date],”MMMM DD, YYYY”)
C. FORMAT([Date],”MMM”)|| FORMAT([Date],”DD”)|| FORMAT([Date],”YYYY”)
D. FORMAT(‘Date_Table’ [Date],”MMM”)|| FORMAT(‘Date_Table’ [Date],”DD”)|| FORMAT(‘Date_Table’ [Date],”YYYY”)
Correct Answer: B
“MMMM” is a user-defined format for date/time that displays the full month name as the month. FORMAT([Date],”MMMM DD, YYYY”) is the right DAX expression.
- Option A is incorrect. The given DAX expression is not correct to show the date in the required format.
- Option B is correct. FORMAT([Date],” MMMM DD, YYYY”) is the right DAX expression to show the date in the required format.
- Option C is incorrect. The given DAX expression is not correct to show the date in the required format.
- Option D is incorrect. The given DAX expression is not correct to show the date in the required format.
Q 3. The data model has an impact on the time consumed in the refreshing of a model but once the model is loaded in the memory, it has no impact on the performance of the reports. Select whether the statement is True/False.
A. True
B. False
Correct Answer: B
In the case of a large data model, the measures need to iterate over more data and therefore the evaluation is likely to consume more time that will certainly affect the performance of the reports. Therefore, reducing the size of the data model by removing the unnecessary rows or columns will help in improving the performance of the reports.
Q 4. What will be the result of the following DAX formula if the year 2020 is chosen on a slicer of a report?
2019 Salary_Cost = CALCULATE([Total Salary_cost], Filter (Date, Date[Year]=2019))
A. Salary_cost for the Year 2020 as Slicer Selection overrides DAX Filter.
B. Salary_cost for the Year 2019 as DAX Filter overrides Slicer Selection.
C. Blank. It will return no records.
D. It will return Salary_cost records for the year 2019 as well as 2020.
Correct Answer: C
First, the given DAX expression was supposed to have a SUM function to calculate the total sales. Moreover, in the given scenario, the Slicer selection for the year 2020 will also be applied along with the DAX expression. It is not possible for any record to have both years i.e year 2019 and year 2020 at the same time. Therefore, the given DAX expression in the current scenario will return nothing.
- Option A is incorrect. Salary_cost for the Year 2020 as Slicer Selection overrides DAX Filter is not the correct answer.
- Option B is incorrect. Salary_cost for the Year 2019 as DAX Filter overrides Slicer Selection is not the correct answer.
- Option C is correct. The DAX expression in the current scenario will return blank as no record can have both years i.e year 2019 and year 2020 at the same time.
- Option D is incorrect. The given DAX expression in the current scenario will return a blank.
Q 5. Which of the following is the right DAX function to modify a single directional relationship to a bi-directional relationship on the fly (within the measure)?
A. TREATAS
B. USERELATIONSHIP
C. CROSSFILTER
D. RELATEDTABLE
E. RELATED
Correct Answer: C
CROSSFILTER is a DAX function that takes the two columns and set the cross filter relationship between these columns.
- Option A is incorrect. TREATAS allows you to create virtual relationships. This function is best to use when there exists no relationship between the tables.
- Option B is incorrect. USERELATIONSHIP function is used to activate the inactive relationships.
- Option C is correct. CROSSFILTER function allows modifying a single directional relationship to a bi-directional relationship.
- Option D is incorrect. RELATEDTETABLE is a DAX function that modifies the context in which the data is filtered, and calculates the given expression in the new specified context.
- Option E is incorrect. RELATED function returns a related value from some other table. To use the Related function, there is a need for a relationship between the current table and the table having related data.
Q 6. What is the use of Row Level Security (RLS) in Power BI?
A. Assigning the security permissions for the underlying Power BI Azure SQL Database
B. Adding the ability to link Power BI Log-in to organizational Active Directory or Window Login through Single Sign On (SSO)
C. Restricting data access for the given users ( By assigning users to roles)
D. Restrictions to specific measures within Power BI reports to some specific users
E. All the above
Correct Answer: C
The use of Row Level Security in Power BI is to restrict or limit the data access for the specified users. The Filters restrict the data access at row-level and filters can be defined within roles. In Power BI service, the members can access the datasets in the workspace. Row Level security does not put restrictions on this data access.
- Option A is incorrect. RLS does not assign the security permissions for the underlying Power BI Azure SQL Database.
- Option B is incorrect. RLS does not add the ability to link Power BI Log-in to organizational Active Directory or Window Login through Single Sign On (SSO) is not the use of RLS in Power BI.
- Option C is correct. The use of RLS is to restrict data access for the given users ( By assigning users to roles).
- Option D is incorrect. RLS does not make restrictions to specific measures within Power BI reports to some specific users.
- Option E is incorrect. The given option is not the right choice.
Q 7. Consider that you want to split your query into two parts. Which of the following options would you use in Power BI?
A. Format Query
B. Split Query
C. Extract previous
D. Mark Query
Correct Answer: C
Extract Previous is the option that helps in splitting the query into parts. If you want to split a query, right-click an applied step (as per desire or requirements) to the query and choose the exact previous option. It will split the query into 2 parts by making a new query consisting of all the steps before the selected step.
- Option A is incorrect. It is the Extract Previous option, not Format Query, that is used to split the query in Power BI.
- Option B is incorrect. It is the Extract Previous option, not Split Query, that is used to split the query in Power BI.
- Option C is correct. Extract Previous is the option that helps in splitting the query into parts in Power BI.
- Option D is incorrect. It is the Extract Previous option, not Mark Query, that is used to split the query in Power BI.
Q 8. Consider the statement below.
Row Level Security can’t be applied in Power BI Desktop while connecting via a Live connection to Analysis Services, these need to be set within the AS model.
A. True
B. False
Correct Answer: B
You can configure Row-Level Security for the data models imported in Power BI through Power BI Desktop. It is also possible to configure Row Level Security (RLS) on the datasets that use DirectQuery, such as SQL Server. But for Analysis Services or Azure Analysis Services live connections, Row-level security is configured within the model, not Power BI Desktop. The AS models hold RLS roles already that can be used by Power BI via a Live connection.
Visualize the data
Q 9. Your team manager has given you a task to create a Power BI dashboard consisting of visualizations for sales data. You have been asked to add some sample questions that can be asked by the users while using the Q&A option. To enable the sample questions, what will you modify in the settings of Power BI?
A. Dashboards
B. Reports
C. Datasets
D. Workbooks
Correct Answer: C
To enable the sample questions for the users, it is the datasets that should be modified in Power BI settings.
- Option A is incorrect. It is the datasets, not the dashboards, that should be modified in Power BI settings.
- Option B is incorrect. It is the datasets, not the Reports, that should be modified in Power BI settings.
- Option C is correct. Datasets should be modified in Power BI settings to enable the sample questions for the users in Q&A analysis.
- Option D is incorrect. It is the datasets, not the workbooks, that should be modified in Power BI settings.
Q 10. You have created a dashboard with the help of Microsoft Power BI Service. The dashboard has a card visual that displays the total sales from the last year.
You provide users access to the dashboard through the Viewer role on the workspace.
A user is interested in receiving daily notifications for the number displayed on the card visual. Which of the following is the right choice to automate the notifications?
A. Creating a data alert.
B. Sharing the dashboard to the user.
C. Creating a subscription.
D. Tagging the user in a comment.
Correct Answer: C
You can subscribe your mates and yourself to the dashboards, report pages, and paginated reports that are significant to you. Power BI e-mail subscription allows you to choose how frequently you are interested in receiving the emails: monthly, weekly, daily, hourly, or once a day after the initial data refresh and even the time you are interested in receiving the email if you select monthly, weekly, daily or hourly.
- Option A is incorrect. Creating a data alert is not the right option. Data alerts are created to notify you when the data in the dashboard is changed beyond the limits set by you.
- Option B is incorrect. Sharing the dashboard to the user is not the right option to automate the notifications.
- Option C is correct. Creating a subscription will help in automating the notification on daily basis for the number displayed on the card visual.
- Option D is incorrect. Tagging the user in a comment is not the right option.
Q 11. You are creating a complex report having a lot of visuals in Power BI. You want to ensure that the users read it in a logical way when they use the keyboard. From the following list, select the right option which you need to work on.
A. Page Order
B. Tab Order
C. Layer Order
D. Field Hierarchy
E. Bookmark Order
Correct Answer: B
Tab order defines the order in which a user interacts with the things on a page through the keyboard. If you want to change the default order, open the selection pane from the view tab and choose the Tab Order.
- Option A is incorrect. It is the Tab order, not Page order, which you need to work on to ensure that the users read in a logical way.
- Option B is correct. Tab order defines the order in which a user interacts with the things on a page through the keyboard. Therefore, to make the users read in a logical way, change the default order from the Tab order.
- Option C is incorrect. It is the Tab order, not Layer order, which you need to work on to ensure that the users read in a logical way.
- Option D is incorrect. It is the Tab order, not Field Hierarchy, which you need to work on to ensure that the users read in a logical way.
- Option E is incorrect. It is the Tab order, not Bookmark Order, which you need to work on to ensure that the users read in a logical way.
Q 12. You have a Consumer Sales Revenue monthly report. You analyze and notice that the attrition Rate metric is sharply increased.
You are interested in understanding the variables that might affect this result.
Which of the following visuals can you use to understand and explore the potential causes in Power BI Desktop?
A. Decomposition tree visuals
B. Funnel Visual
C. Key Influencer Visual
D. Combo visual
E. Waterfall Visual
Correct Answers: A and C
Decomposition Tree is an Artificial Intelligence visual that is ideal for ad hoc exploration and conducting root cause analysis. It helps in automatically analyzing the chosen dimensions to check where the measure is having the lowest or highest value. key influencer visual is another visual that is a good choice to know the factors that influence a key metric.
- Option A is correct. Decomposition tree visuals can be used to understand and explore the potential causes of sharp increment in attrition Rate metric in the given scenario.
- Option B is incorrect. A funnel chart displays a linear process consisting of sequential connected stages and the items flow sequentially from one stage to the next stage. It’s not the right choice for the desired purpose.
- Option C is correct. Key influencer visual is another visual that is an excellent choice to know the factors that influence a key metric and therefore can be used to understand and explore the potential causes of sharp increment in attrition Rate metric in the given scenario.
- Option D is incorrect. Combo visual is the ideal choice for comparing multiple measures with different value ranges, not for the desired purpose.
- Option E is incorrect. Waterfall visual is the ideal choice to show the beginning and ending headcount for the organization in a year, not for the desired purpose.
Q 13. You have several dashboards. You want to ensure that when the users browse the available dashboards from powerbi.com, they should be able to view which dashboards have personally identifiable information (PII). The solution needs to minimize the configuration efforts and effect on the dashboard design.
Which of the following would you use?
A. Tiles
B. Comment
C. Active Directory groups
D. Data Classifications
E. Feedback
Correct Answer: D
With the help of dashboard data classification, you can raise awareness with the viewers of the dashboards about the level of security that should be utilized. You can tag your dashboards with classifications mentioned by the IT department of your company, so everyone seeing the content will have the same level of information and understanding around the sensitivity of the data.
Therefore, by using data classification, you can make sure that when the users browse the available dashboards from powerbi.com, they can view which dashboards have personally identifiable information (PII).
- Option A is incorrect. Using data classification, not tiles, is the right solution.
- Option B is incorrect. With the help of the Comment feature in the Power BI Dashboard, it is possible to get feedback from the users and make those features visible to other users as well. Using data classification is the right solution.
- Option C is incorrect. Using data classification, not Active Directory Group , is the right solution.
- Option D is correct. Using data classification, you can make sure that when the users browse the available dashboards from powerbi.com, they can view which dashboards have personally identifiable information (PII).
- Option E is incorrect. Using data classification, not Feedback is the right solution.
Analyze the data
Q 14. Which of the following Azure Cognitive Services models can be called through the AI insights feature in Power BI Desktop? (Select Multiple Options)
A. Sentiment Analysis
B. Key Phrase Extraction
C. K-mean Clustering
D. Language Detection
E. Binary Classification
F. All of the above
Correct Answers: A, B, and D
AI Insights option in Power BI Desktop includes Azure Cognitive Services models -Sentiment Analysis, Key Phrase Extraction, and Language Detection. These models help derive the meaning or specific pieces of language from text data. For example, the Sentiment Analysis or Key Phrase Extraction option can be used to know the customer sentiments in the Help tickets and visually demonstrate the results in Power BI.
- Option A is correct as Sentiment analysis is an Azure cognitive services model that can be called through the AI insights feature of Power BI Desktop.
- Option B is correct as Key Phrase Extraction is an Azure cognitive services model that can be called through the AI insights feature of Power BI Desktop.
- Option C is incorrect as the K-mean clustering model is not available through AI insights to feature in Power BI Desktop.
- Option D is correct as Language Detection is an Azure cognitive services model that can be called through the AI insights feature of Power BI Desktop.
- Option E is incorrect as the Binary Classification model is not available through the AI insights to feature in Power BI Desktop.
- Option F is incorrect as K-mean clustering and Binary classification models are not available through the AI Insights feature.
Q 15. Which of the following chart is the great choice to identify or display the outliers?
A. Line Chart
B. Scatter Chart
C. Bar chart
D. Donut chart
Correct Answer: B
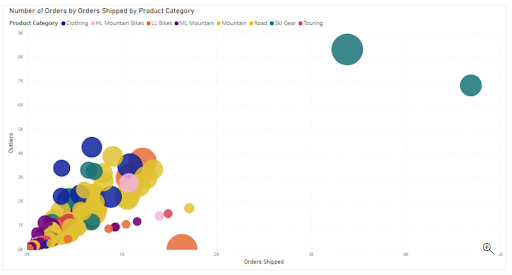
Scatter chart is the best choice to identify the outliers in the data. After identification of the outliers, the reasons for their existence can be investigated or explored and corrective action is taken. The following is an example of a “Scatter chart” that shows the number of orders by Orders Shipped by Product Category.
- Option A is incorrect as Line charts are not appropriate to display the outliers. Scatter charts are the better choice.
- Option B is correct as the Scatter chart is a good choice to display the outliers.
- Option C is incorrect as Bar charts are not appropriate to display the outliers. Scatter charts are the better choice.
- Option D is incorrect as the Scatter chart, not Donut charts, are a good choice to display the outliers.
Q 16. You need to create a report that will demonstrate the sales performance of the company. The sales team has requested you to add a single visualization (if possible) that might help them in identifying the factors that drive the sales and affect the success. Which of the following visualization would you use?
A. Key influencers
B. Funnel chart
C. Donut Chart
D. Q&A visualization
Correct Answer: A
key influencers are a specific type of visuals that help in identifying the factors that drive the target matric. It analyzes the given data, ranks the factors that matter, and shows them as key influencers. The two most important scenario where key influencers do great are :
To see the factors that affect the metric being analyzed.
To contrast the relative importance of the identified factors.
- Option A is correct as Key influencers are a good choice to identify what factors drive the sale and affect the success.
- Option B is incorrect. The funnel charts display a linear process that consists of sequential connected stages and the items flow sequentially from one stage to the next stage. They don’t help in identifying the factors that affect a metric.
- Option C is incorrect. Donut charts represent the data by dividing it into slices and are not helpful in identifying the key factors.
- Option D is incorrect. Q&A visualizations allow the users to ask natural language questions and get answers in the form of a visual.
Q 17. There is a dashboard named Salary_Cost having Q&A enabled on it. When a user tries to get the count of Employees, the query gets failed. On the other hand, when the user asks for the count of workers, the query returns the expected result.
You need to ensure that the same result is returned by both queries. Which of the following actions would you perform?
A. Editing synonyms from the Power BI service
B. Editing Relationships from the Power BI Desktop
C. Editing synonyms from the Power BI Desktop
D. Editing tables from the Power Query in Power BI Desktop
Correct Answer: C
When you are interested in improving the Q&A experience, it is always a good practice to add synonyms from the Power BI Desktop Model view.
- Option A is incorrect. Editing synonyms from the Power BI service is not the right choice. Instead, you should edit synonyms from the Power BI Desktop.
- Option B is incorrect. Editing Relationships from the Power BI Desktop is not the right option to ensure that both above said queries return the same result.
- Option C is correct. To ensure that both above said queries return the same result, you should edit synonyms from the Power BI Desktop.
- Option D is incorrect. Editing tables from the Power Query in Power BI Desktop is not the right option to ensure that both above said queries return the same result.
Q 18. Which of the following tasks can’t be performed using the dataset settings option of the Power BI Service?
A. Modify query editor parameter values
B. Check the cardinality for the columns in the dataset
C. Mark the dataset as certified or promoted
D. Change the credentials used for connecting to the underlying data source
E. Define the sensitivity label for the dataset
Correct Answer: B
Using the dataset settings option in Power BI, you are able to modify query editor parameter values, mark the dataset as certified or promoted, change the credentials used for connecting to the underlying data source and define the sensitivity label for the dataset. But it is not possible to view or check the cardinality of the columns using this option.
- Option A is incorrect. It is possible to modify query editor parameter values using the dataset setting option.
- Option B is correct. It is not possible to check the cardinality for the columns in the dataset using the dataset setting option.
- Option C is incorrect. It is possible to mark the dataset as certified or promoted using the dataset setting option.
- Option D is incorrect. It is possible to change the credentials used for connecting to the underlying data source using the dataset setting option.
- Option E is incorrect. It is possible to define the sensitivity label for the dataset using the dataset setting option.
Deploy and maintain deliverables
Q 19. Here is the list of configuration steps (given in improper sequence) for Row-level security (RLS).
- Create a report in Microsoft Power BI Desktop that involves import the data, confirm the data model between both tables, and create the report visuals.
2. Create RLS roles in Power BI Desktop by using DAX.
3. Test the roles in Power BI Desktop.
4. Add members to the role in the Power BI service.
5. Deploy the report to Microsoft Power BI service.
6. Test the roles in the Power BI service.
The correct sequence of steps for RLS configuration is :
A. 1-3-2-4-5-6
B. 1-2-3-5-4-6
C. 1-3-2-5-4-6
D. 1-2-6-4-5-3
E. 1-2-3-4-6-5
Correct Answer: B
The correct sequence of steps for RLS configuration is to create a report in Microsoft Power BI Desktop that involves import the data, confirm the data model between both tables and create the report visuals, Create RLS roles in Power BI Desktop by using DAX, Test the roles in Power BI Desktop, Deploy the report to Microsoft Power BI service, Add members to the role in Power BI service and Test the roles in Power BI service.
Q 20. Which of the following tasks can be done only by the workspace admin, not by the users with lesser authorities and privileges?
A. Creating, editing, or deleting the content in the workspace
B. Publishing workspace content in the app
C. Adding or removing the other users from the workspace
D. Creating a report in another workspace depending upon the dataset of this workspace
E. Scheduling the data refreshes
Correct Answer: C
Out of the given tasks, only adding or removing the other users is the only task that can be performed only by the workspace admin. All other given tasks can be performed even by the members of the workspace.
- Option A is incorrect. Admin is not the only workspace role that can create, edit or delete the content in the workspace. Even the workspace members are able to do this.
- Option B is incorrect. Admin is not the only workspace role that can publish the content to an app. Even the workspace members are able to do this.
- Option C is correct. Only the workspace admin has the authority of adding or deleting other users from the workspace.
- Option D is incorrect. Creating a report in another workspace depending upon the dataset of this workspace is not the privilege of the admin only. Even the workspace members can do this.
- Option E is incorrect. Scheduling the refreshes is not the privilege of the admin only. Even the workspace members can do this.
Q 21. Which of the following options is not a privacy level in Power BI desktop?
A. Private
B. Public
C. Organizational
D. Confidential
Correct Answer: D
In Power BI Desktop, a privacy level specifies an isolation level that specifies the degree to which one data source is isolated from other data sources. There are three possible privacy levels for data sources – private, public, and organizational. Here is the table describing the different privacy levels.
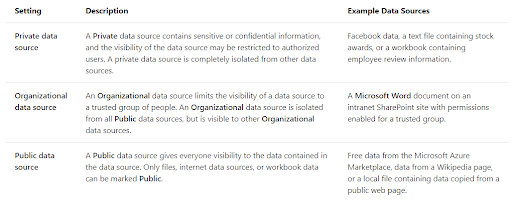
- Option A is incorrect. Private is a valid privacy level in Power BI Desktop.
- Option B is incorrect. Public is a valid privacy level in Power BI Desktop.
- Option C is incorrect. Organizational is a valid privacy level in Power BI Desktop.
- Option D is correct. Confidential is not a valid privacy level in Power BI Desktop.
Prepare the data
Q 22. For the query opened in Power Query Editor, you are interested in finding out the percentage of empty cells or values in each column as soon as possible. Which of the following data Preview Options would you select?
A. Column profile
B. Show Whitespaces
C. Column quality
D. Column distribution
Correct Answer: C
In Power Query Editor, Column Quality, Column distribution, and Column Profile are data profiling functionalities under the View tab in Data Preview Section. These functionalities help in understanding the data anomalies and statistics. Out of these three functionalities, Column quality is the one that can be used to show the percentages of data that is in error, empty and valid.
- Option A is incorrect. The Column profile provides a deeper look into the statistics within the column. This column can be used to provide many different values like the count of rows but it does not help in identifying the percentage of empty cells in the column.
- Option B is incorrect. Using Column Quality, not Show Whitespaces, is the correct option.
- Option C is correct. Column quality is the data preview option that is used to show the percentages of data that is in error, empty and valid.
- Option D is incorrect. Column distribution displays the data distribution within the column and the counts of unique and distinct values. It is not the right choice for the target goal.
Q 23. There is an Azure SQL database having the records for sales transactions. The database is updated on a frequent basis. You need to create reports from the sales data to identify fake transactions. The data needs to be visible within 5 minutes of an update.
How can the data connection be configured to achieve the target?
A. By adding a SQL statement
B. By setting the data connectivity mode to DirectQuery
C. By setting the Command timeout in minutes setting
D. By setting the data connectivity mode to Import
E. By adding a PL/SQL statement
Correct Answer: B
While connecting to a data source in Power BI Desktop, it is always possible to import a copy of the data in Power BI Desktop. Some data sources have the option of connecting directly to the data source using DirectQuery. With the DirectQuery option, no data is imported or copied to Power BI Desktop. For relational sources, the chosen columns and tables appear in the Fields list. In multi-dimensional sources such as SAP Business Warehouse, the dimensions and measures for the chosen cube appear in the Fields list. As you interact with the visualization, Power BI queries the underlying data source and you always view the current data.
- Option A is incorrect. Adding a SQL statement is not the correct configuration for the data connection.
- Option B is correct. The data connectivity mode should be set to DirectQuery.
- Option C is incorrect. To set the Command timeout in minutes setting is not the correct option.
- Option D is incorrect. Setting the data connectivity mode to Import is not the right option. In Import mode, the selected columns and tables are imported into Power BI Desktop. As you build or interact with any visualization, then the Power BI Desktop utilizes the imported data. To view the data updates since the most recent refresh or initial import, you need to refresh the data that will import the full dataset again.
- Option E is incorrect. Adding a PL/SQL statement is not the correct configuration for the data connection.
Q 24. Which of the following is a potential way to improve the performance while getting the data in Power BI?
A. Combining the date and time columns in a single column
B. Pulling the data only into Power BI Service, nor Power BI Desktop
C. Performing some calculations in the original data source
D. Using SELECT SQL statement in SQL queries while pulling the data from a relational database
Correct Answer: C
Power Query and Power Query Editor are designed to allow you to process the data, but the processing power needed to do this may decrease the performance in other areas of your reports. Therefore, it is always a good practice to process as much as possible data in the original data source.
- Option A is incorrect. Combining the date and column in a single column is not the right option as Separating the columns date and time will enhance the compression and therefore the performance.
- Option B is incorrect. Pulling the data only into the Power BI Service is not the right option as there is no performance difference between Power BI service and Power BI Desktop.
- Option C is correct. It is always a good practice to process as much as possible data in the original data source to improve the performance.
- Option D is incorrect. Using a SELECT SQL statement in SQL queries while pulling the data from a relational database might decrease the performance as in this way, you are likely to get more rows and columns than needed.
Q 25. Suppose you have developed a query named consumers in Power BI Desktop to append the rows from 3 external tables with consumer data into a single table consumer.
Now you want to ensure that each row in the consumer table has a unique ID value. Which of the following is the best way to add a new fabricated ID column to the consumer table?
A. Changing the data model by extending the consumers table with an Index column
B. Changing the data model by extending consumer table with a Counter column
C. Modifying the consumers’ query by adding an Index column
D. Modifying the consumers’ query by adding a Counter column
Correct Answer: C
Query editor has an option Index Column to add an indexed column starting from 1,0 or any custom number. “Insert Index Column” is present in the “Add Column” tab that allows the creation of a new index column starting from 0, 1, or any custom number. Users can customize the starting value and row increment for the index.
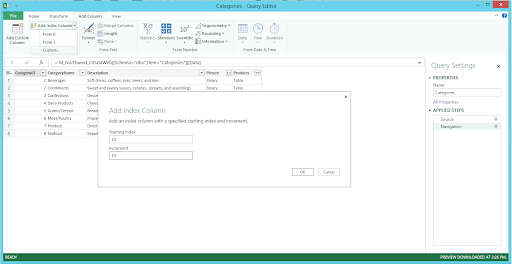
- Option A is incorrect. Modifying the consumers query by adding an Index column is the best way to add a new ID column to the consumer table.
- Option B is incorrect. Modifying the consumers query by adding an Index column is the best way to add a new ID column to the consumer table.
- Option C is correct. Modifying the consumers’ query by adding an Index column is the best way to add a new ID column to the consumer table.
- Option D is incorrect. Modifying the consumers’ query by adding an Index column is the best way to add a new ID column to the consumer table.
Bottom line
We hope these questions offer a glimpse into how the real exam would look like. When are you planning to write the DA-100 Exam? If you need to practice more, check our free practice exam for DA-100.
Reference Links:
- https://docs.microsoft.com/en-us/learn/certifications/exams/da-100
- https://docs.microsoft.com/en-us/dax/calculate-function-dax
- https://docs.microsoft.com/en-us/dax/crossfilter-function
- 25 Free Questions – Certificate of Cloud Security Knowledge V.4 - December 13, 2021
- 25 Free Questions on PL-900 Exam Certification - December 3, 2021
- 50 Free Terraform Certification Exam Questions - December 2, 2021
- 25 Free Questions – GCP Certified Professional Cloud Network Engineer - December 2, 2021
- 25 Free Questions – Microsoft Power BI PL-300 (DA-100) Certification - December 2, 2021
- 25 Free Questions – Google Cloud Developer Certification Exam - November 30, 2021
- 25 Free Questions – Google Cloud Certified Professional Security Engineer - November 30, 2021
- 25 Free Questions – Google Cloud Certified Professional Machine Learning Engineer - November 30, 2021