
The AWS Health Dashboard plays a crucial role in monitoring and maintaining the overall health of AWS services.
By understanding the intricacies of the AWS Personal Health Dashboard, AWS Certified Cloud Practitioners can effectively ensure the health and performance of AWS services under their purview.
This blog delved into a comprehensive exploration of the AWS Personal Health Dashboard, shedding light on key aspects including its features, pricing details, use cases, and more.
Let’s dive in!
Introduction to AWS Health Dashboard
The AWS Health Dashboard offers a personalized overview of the status of your AWS resources, accounts, and the services you utilize. This dashboard provides alerts and guidance related to AWS events that could impact your environment.
It displays the latest ongoing events, aiding in the effective management of your current operations, and offers proactive notifications to assist in scheduling activities accordingly. The AWS Personal Health Dashboard is accessible to any AWS customer.
The dashboard presents pertinent and timely information to aid users in overseeing ongoing events and provides advance notification to assist users in planning scheduled activities. Utilizing the AWS Health Dashboard enables users to gather insights into AWS events. The AWS Health Dashboard presents information in the following manners:
- Events specific to your account.
- Events relevant to your organization.
Information available in the AWS Health Dashboard
The AWS Health Dashboard presents information in the following ways:
- General Service Events: Provides details such as event name, affected region, service name, recent updates on events, and a list of AWS services impacted by these events.
- Your Account Events: Displays information on events, including recent, open, and scheduled changes, and notifications. Also, features an event log showcasing all events from the past 90 days specific to your account.
- Organization Events: Similar to Your Account Events but extends to the entire organization. Offers a view of events, recent, open, scheduled changes, and notifications. The event log covers all events from the past 90 days but for the entire organization.
- Health Integration: Through integration with AWS Organizations, AWS Health provides events for all accounts within your company. These events are crucial for monitoring changes in resources, applications, and other services across the organization.
AWS Health Dashboard Pricing
The AWS Health Dashboard operates on a subscription-based pricing model. It offers different plans, starting with Developer at $29.00, followed by Business at $100.00, and Enterprise at $15,000.00.
When to go for the AWS Health Dashboard?
There are several compelling reasons to utilize the Personal Health Dashboard, offering a detailed perspective on the behavior of AWS services in conjunction with your actual cloud instances. Here are a few key benefits:
More Personalized View
The Personal Health Dashboard provides a customized view of each AWS service supporting your applications. This facilitates the quick identification of AWS issues that could potentially impact you and the applications you are running.
Troubleshooting Assistance
Beyond receiving alerts, the dashboard offers remediation details and guidance, empowering users with actionable insights to address potential impacts during problematic scenarios.
Proactive Notifications
Users can set up proactive notifications, delivering forward-looking information through email and mobile notifications. This feature aids in planning for scheduled changes that might affect applications. Alongside details about scheduled maintenance activities, users also receive guidance on avoiding issues related to upcoming downtime.
Detailed Information
For each event, the dashboard provides detailed information, including the affected AWS services, the regions impacted, and the current status of the issue. This information enables users to understand the scope and severity of the problem.
Historical Data
Users can access historical data to review past events and their resolutions. This feature helps in identifying patterns, understanding the frequency of incidents, and evaluating the overall reliability of AWS services over time.
API Access
AWS Health Dashboard offers programmatic access through APIs, allowing users to integrate health status information into their own applications, dashboards, or monitoring systems. This enables a seamless integration of health monitoring into existing workflows.
Integration Possibilities
The integration of AWS Personal Health Dashboard with Amazon CloudWatch Events allows the creation of custom rules for automated remediation actions in the event of AWS service issues. Additionally, leveraging the AWS Health API enables seamless connectivity and data integration with internal or third-party tools.
Utilizing the Personal Health Dashboard provides a comprehensive solution for monitoring, troubleshooting, receiving proactive notifications, and integrating with other AWS services and external tools.
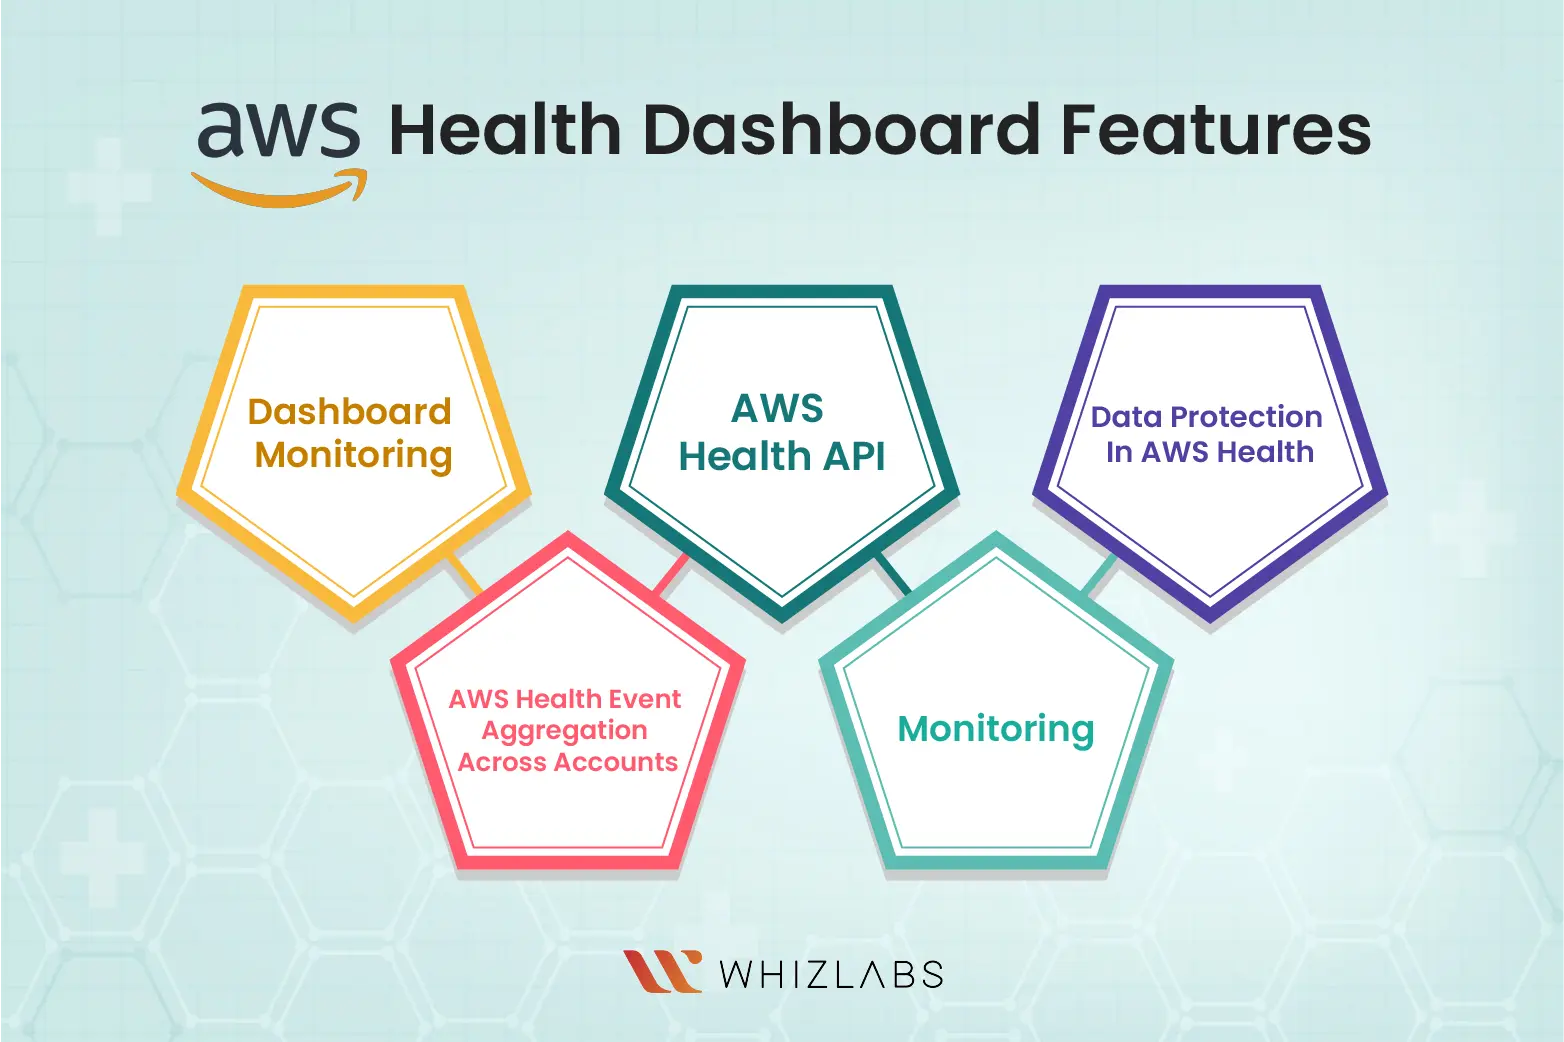
AWS Health Dashboard Features
Dashboard monitoring: In the AWS, there are two major dashboards: AWS Service Health Dashboard and Personal Health Dashboard are available to assist you in finding the concerns that might affect the operations of the infrastructure and resources running within the AWS environment.
AWS Health API: It is a restful service available online and it uses HTTP as the major transportation protocol and JSON as a message serialization language. The requests that arrive at the AWS Health API may come from the application code. It is necessary to write the code to sign and authenticate the requests while using REST API directly.
Data Protection In AWS Health: The AWS shared responsibility paradigm outlines that AWS is accountable for securing the global infrastructure that underpins the entire AWS Cloud. On the other hand, users are responsible for managing and safeguarding the data hosted on this infrastructure. This section focuses on security configuration and administration tasks related to AWS outage management.
AWS Health Event Aggregation Across Accounts: When it comes to AWS Health Event Aggregation Across Accounts, by default, AWS Health allows users to view events for a single AWS account. However, for a more centralized approach across your organization, leveraging AWS Organizations enables the observation of AWS Health events at a broader level.
This feature provides access to the same data available in single-account operations. Utilizing filters allows for a granular examination of events based on specified AWS Regions, accounts, and services.
Aggregating occurrences becomes beneficial for identifying the impact of operational events on various accounts within your organization or for proactively addressing security vulnerabilities. The insights gained from this aggregated data can be instrumental in monitoring and automating resource maintenance events across your business.
Monitoring: Monitoring is essential for ensuring the dependability, scalability, and efficiency of AWS Health and other AWS offerings. AWS offers the Amazon CloudWatch tool to keep an eye on AWS Health, report if something is incorrect, and take immediate action.
How to Check the service health in the AWS Health Dashboard?
The AWS Health Dashboard, specifically the Service Health section, offers a comprehensive overview of the current status of all AWS services across different regions. This valuable tool ensures real-time visibility into any reported service events, allowing users to stay informed about potential issues.
To check service health, follow these steps:
- Accessing the Dashboard: Go to the home page of AWS Health Dashboard – Service. If already logged into your AWS account, you may be redirected to your personalized dashboard.
- Reviewing Recent Events: Navigate to “Service health” and select “Open and recent issues.” Here, you’ll find details such as event name and affected region (e.g., “Operational issue – Amazon Elastic Compute Cloud (N. Virginia)”), service name, event severity (categorized as “Informational” or “Degradation”), a timeline with updates, and information about other AWS services impacted by the event.
- Customize Your View: You can tailor your view by choosing to see events in your local time zone or UTC, according to your preferences.
- Stay Updated with RSS: For real-time updates, subscribe to an RSS feed for a specific event. This ensures timely notifications about any changes or updates for a particular service in a specific AWS region.
- Dive Deeper with Service History: Click on “Service history” to view a detailed table showcasing all AWS service interruptions from the past year. This table can be filtered in terms of Service, AWS Region, and date to achieve a customized view.
- Event Status Icon: To get a detailed overview of an ongoing event, click on the status icon next to it. This provides in-depth information about the event in question.
By following these steps, users can effectively monitor and manage the health and status of AWS services, making informed decisions based on real-time information and historical service interruptions.
AWS Health Monitoring through AWS Services
Effectively monitoring AWS Health is crucial for ensuring optimal reliability, availability, and performance within your AWS architecture. AWS provides a suite of monitoring tools, each serving distinct purposes, allowing you to oversee AWS Health and respond to anomalies vigilantly.
Amazon CloudWatch
You can utilize CloudWatch to monitor AWS Health metrics, promptly detecting and responding to potential issues.
Key Features
- Metrics Collection: Collect detailed metrics in real time.
- Custom Dashboards: Personalize dashboards for a comprehensive view of applications and the AWS ecosystem.
- Alarms: Set alarms for specific metrics to receive notifications or trigger actions upon breaching thresholds.
Amazon EventBridge
You can leverage EventBridge to stay informed and react promptly to AWS Health events.
Key Features
- Event Notifications: Receive alerts about AWS Health events impacting your services.
- Responsive Actions: Make timely decisions based on notifications, such as updating resources or deploying alternatives.
AWS CloudTrail
Monitor AWS Health-related API calls with CloudTrail, understanding user interactions and potential resource changes. Refer to the AWS CloudTrail User Guide for comprehensive insights.
Key Features
- API Call Capture: Record details of AWS API calls, including origin, timestamp, and user.
- Detailed Logging: Gain insights into user and account activities for auditing and security analysis.
Choosing between CloudWatch, EventBridge, and CloudTrail depends on specific monitoring needs. CloudWatch focuses on real-time metric monitoring, EventBridge on event-driven responses, and CloudTrail excels at tracking user activities through API call logs. For a comprehensive AWS Health monitoring strategy, consider integrating aspects of all three tools.
FAQs
What is the difference between the AWS Service Health dashboard and the AWS Personal Health dashboard?
Although these services may appear similar, the Service Health Dashboard furnishes an overview of the overall status of AWS services, whereas the Personal Health Dashboard offers personalized insights into the availability and performance of the specific AWS services actively employed by you.
What are the benefits of the CloudWatch dashboard?
CloudWatch dashboards from Amazon offer the advantage of creating reusable graphs, providing a consolidated view of your cloud resources and applications. These dashboards allow you to visualize metrics and log data together, facilitating a swift transition from problem diagnosis to understanding the underlying causes by presenting comprehensive context.
How to create a dashboard in CloudWatch?
To generate a CloudWatch dashboard using the console, start by accessing the CloudWatch console at https://console.aws.amazon.com/cloudwatch/. Navigate to the Dashboards section in the side menu and select “Create a dashboard.” Within the “Create new dashboard” dialog box, input a name for the dashboard, and then click on the “Create dashboard” option.
How to share a CloudWatch dashboard?
CloudWatch Dashboards can be shared using three methods:
- Restricted Sharing: Share a specific dashboard by specifying email addresses and passwords for authorized individuals who can view it.
- Public Sharing: Share a particular dashboard publicly, allowing anyone with the shared link to access and view it.
- SSO Integration: Share all CloudWatch dashboards in your account by integrating a third-party single sign-on (SSO) provider. Users listed in this SSO provider’s membership can then access the dashboards in the account.
Conclusion
Hope this blog has provided an in-depth exploration of the AWS Health Dashboard, covering essential aspects such as features, pricing details, and use cases.
Armed with this comprehensive understanding, AWS Certified Cloud Practitioners are better equipped to navigate and leverage the capabilities of the AWS Personal Health Dashboard, ensuring the optimal health and performance of AWS services within their domain.
If you want to be well-versed practically in AWS services, explore our AWS hands-on labs and AWS sandboxes.
- AWS Security Specialists: Essential in Modern Cybersecurity - August 16, 2024
- Cloud Developer Tools Showdown: AWS vs Azure vs GCP - August 14, 2024
- Master AWS Lambda and API Gateway for Application Development - August 6, 2024
- Benefits of AWS Developer Associate Certification which Can Boost Your Career - July 24, 2024
- Preparation Guide on Datadog Fundamentals Certification - July 17, 2024
- What is DLP in Power Automate? - June 5, 2024
- Top Data Engineering Certifications in 2024 - May 30, 2024
- How Difficult is Google Cloud DevOps Engineer Certification? - May 29, 2024