
Project Management Mathematics IV- Planning
This article will cover the following tools and technique of Perform Qualitative Risk Analysis and Perform Quantitative Risk Analysis.
- Expected Monetary Value
- Decision Tree
- Risk probability and impact calculations
Expected Monetary Value
Expected monetary value (EMV) analysis is a statistical technique that calculates the average, anticipated future impact of the decision. EMV is calculated by multiplying the probability of the risk by its impact for two or more potential outcomes (for example a good outcome and a poor outcome) and then adding the results of the potential outcomes together. EMV is used in conjunction with the decision tree analysis technique, which is covered next. Positive results generally mean the risks occurring are opportunities to the project, while negative results generally indicate a threat to the project.
EMV = P * I Where P is the Probability and I = Impact
Example
This example shows how to calculate the total EMV
| Work Package | Probability (P) | Impact (I) | EMV (P * I) |
| A |
25% |
$15000 | $3750 |
| B |
40% |
-$2000 | -$800 |
| C |
10% |
-$10000 | -$1000 |
| D |
5% |
$20000 | $1000 |
| Total EMV | $2,950 |
Decision Tree Analysis
Decision trees are diagrams that show the sequence of interrelated decisions and the expected results of choosing one alternative over the other. Generally more than one choice or option is available when it comes to arriving to a decision or, in this case, potential outcomes from a risk event. The available choices are depicted in tree form starting at the left with the risk decision branching out to the right with possible outcomes. Decision trees are usually used for risk events associated with time or cost. Figure below shows a sample decision tree with the Initial cost of buying the new car =$21,000 and that of buying the old car =$16000.
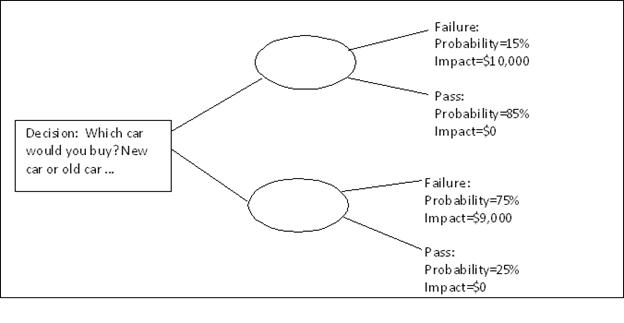
The expected monetary value of the decision is a result of the probability of the risk event multiplied by the impact for two or more potential outcomes and then summing their results. The square in this figure represent decision to be made, and the circles represent the points where risk events might occur.
The decision of buying the New Car or Old car
New Car: $21000 + ($10000*15%) + ($0*$85%) =$ 22,500
Old Car: $16000 + ($9000*75%) + ($0*$25%) =$ 22,750
So with an expected value of $22,500 is the correct decision is to buy the new car.
Risk Probability and impact Calculations
The tool and technique Risk probability and impact assessment calculate the probability that the risk events identified will occur, and it determines the effect their impacts have on the project objectives, including time, scope, quality, and cost.
- Probability: Probability is the likelihood that an event will occur. The classic example is coin tossing. The probability of getting a heads is .50 and getting tails is also .50 on the flip. Note that the sum of probability that an event will occur and the probability that the event will not occur always equals 1.0. In this coin-flipping example, there is .50 chance of getting heads on the flip. So there is .50 chance of not getting heads on the flip. The two responses added together equal 1.0. Probability is expressed as a number from 0.0—which means there is no probability of the event occurring—to 1.0—which means there is 100% certainty the risk will occur.
- Impact: Impact is the amount of pain (or the amount of gain) the risk event poses to the project. The risk impact scale can be a relative scale (also known as an ordinal scale) that assigns values such as high-medium-low or a numeric scale known as a cardinal scale. Cardinal scale values are actual numeric values assigned to the risk impact. Cardinal scales are expressed as values from 0.0 to 1.0 and can be stated in equal (linear) or unequal (nonlinear) increments. Table below shows a typical risk impact scale for cost, time, performance and quality objectives based on a high-high to low-low scale. When using a high-medium-low scale, it’s important that the organization’s risk team understands what criteria was used to determine a high score versus a medium or low score and how these should be applied to the project objectives.
| Objectives | Low – Low | Low | Medium | High | High – High |
| Cost | No significant Impact | Between 1 to 5 % increase | Between 5-10% increase | Between 10 – 18 % increase | More than 18% increase |
| Time | No significant Impact | Between 1 to 5 % increase | Between 5-15% increase | Between 15 – 20 % increase | More than 20% increase |
| Performance | Slight Impact | Slight Impact | Impact on less significant areas | Very slow | Not accepted |
| Quality | No significant Impact | Some modules impacted | Significant impact requiring customer approval | Not accepted | Product is of no use |
- Probability and Impact Matrix: A probability and impact matrix prioritizes the combination of probability and impact scores and helps you determine which risks need detailed risk response plans. For example, a risk event with a high probability of occurring and a high impact will likely need a response plan. This matrix is typically defined by each organization internally.
Questions & Answers
- 1. Decision tree analysis can be classified as _______________________?
- A. A subset of EMV technique
- B. A probabilistic outcome prediction method
- C. A risk response strategy
- D. A superset of EMV technique
Correct Answer: B. The decision tree is a diagram describing different decisions under consideration and the impact on the project of choosing one over the other.
- From the data given below, which project risk should be addressed first?
Given that Low=$10k, Medium=$20K, High=$35KProject Impact Probability Cost A Low 10%
$20K B Medium 25%
$28K C Low 30%
$27K D High 20%
$25K - A. Project A
- B. Project B
- C. Project C
- D. Project D
Correct Answer: B. Applying the formula, the expected monetary value=cost +Probability*Impact
This value is highest for Project B $28 + (20*25%)=$33K
Take a Free Demo of Whizlabs PMP Offerings:
PMP Exam Questions
PMP Online Training (with full length videos)
PMP Live Virtual Classroom Training
- What are Scrum roles and why it’s needed? - August 12, 2017
- Stakeholder Analysis – Is it required? - July 28, 2017
- Project Manager – An integrator, how? - July 28, 2017
- Different PMI Certifications – Which one to choose? - July 28, 2017
- What is the importance of Change Management in Project Management? - June 23, 2017
- What’s important to know to build a career in Agile? - June 23, 2017
- Agile Basics, Manifesto & Principles - June 23, 2017
- Scrum – Is it mandatory to learn in today’s IT market? - June 2, 2017