

Digital Transformation has become the crux of working for IT professionals these days. Every industry is undergoing a fundamental transformation. In the future, all companies will be digital companies – not only building products, but services to capture new business opportunities and engage with customers differently to meet their evolving expectations.
To disrupt and innovate, organisations must take on a strategy that connects their customers, employees, products, and operations as effectively as possible.
Whizlabs, on 5th January 2022, conducted an informative session with Mr. Aroh Shukla on ‘How to get started with Power BI’.
Aroh is a Microsoft Certified Trainer and an MVP (Most Valuable Professional) for Data Platform. His expertise lies in the Power Platform, Microsoft Teams and SharePoint online. He is a Nintex Virtual Technical Evangelist, and a Prosci Certified Change Management Practitioner and has been the co-organiser of the SQL Pass Singapore Chapter. He helps customers across industries in their digital transformation journey by building bespoke solutions based upon the cutting edge Microsoft Technologies.
Here follows a brief on what he discussed during the Webinar.
What is Digital Transformation?
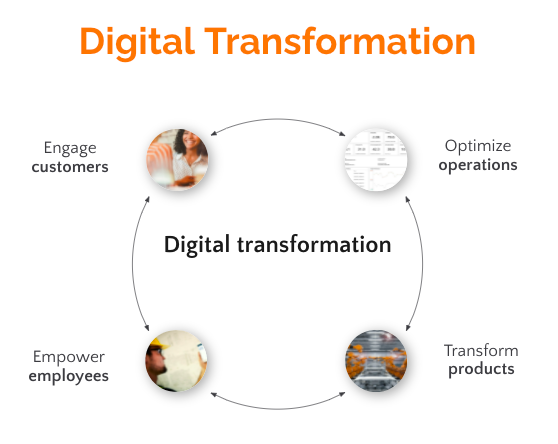
Following the COVID Protocols, a lot of people are working from home and office too, which carries four major components for digital transformation:
- Engage Customers: You might have your own company or the vendor, and in both the cases you need to engage the customer. The security and operations teams have to be kept engaged.
- Optimise Operations: It is essential for operations to be smooth to support digital transformation.
- Transform Products: For Instance, Netflix started with a VD shop but later changed to live online streaming, evolving to the current scenario, and transformed into one of the largest media companies. So, if you wish to learn and innovate, there exists a need for transformation of the products.
- Empower Employees: Employees are required to learn and unlearn technology. For instance, the IT guys have to learn new technologies and keep themselves updated all the time.
The Digital Feedback Loop
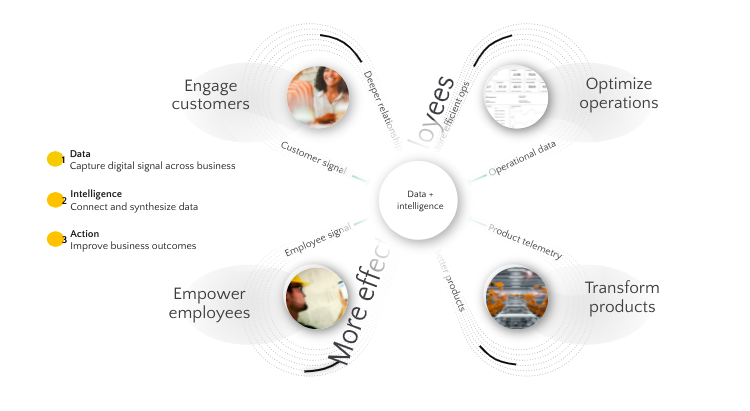
We have a kind of relationship with the customer. So, if they do not understand things, we give them some form of training sessions, and we get engaged with them.
If one of the products doesn’t work or the licence is expired, you have to buy a new licence.The product should always be innovative and updated regularly regarding its security.Data Intelligence and actions are the key for Digital Transformation.
Microsoft Power Platform
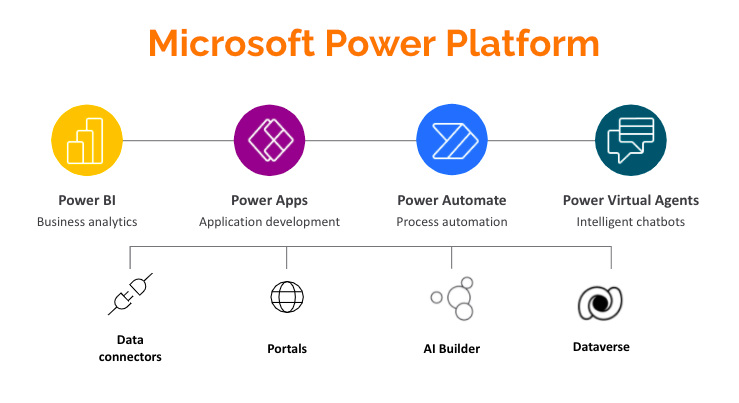
This is the low-code platform that spans Office 365, Azure, Dynamics 365, and standalone applications.
The Microsoft Power Platform contains a lot of services. The four main services are:
- Power BI
- Power Apps: This is for App Development, wherein you can make an app. For Instance, the scanning curve of your business card, where there exists a purchase request and you have to build a form for collecting the data about the purchase request.
- Power Automate: For instance, you have to send an email which will further be sent to a new record in the CRM system.
- Power Virtual Agents: This includes the Intelligent Chatbots.
Data Connectors: Eg: Sharepoint, SAP, Oracle. These data connectors work quite well with the above mentioned applications.
Evolution of BI
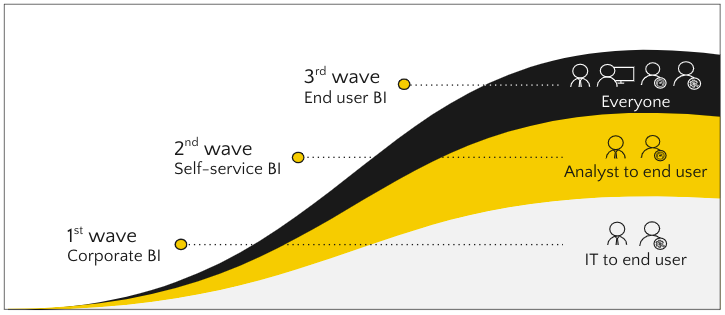
The IT guys manage the corporate BI. Now, the problem is that they have problems with the end users and the question could be very large and difficult to understand. So, they can’t scale because the IT teams are lean and the number of users could range from thousand to ten thousand. Hence, this is not a scalable model.
The second model belongs to MIcrosoft, in which they are trying to solve the problem with an Analyst, wherein you enable the analyst. These analysts know about the power pivot excel and they have knowledge, but the problem is that the end users have no idea on Power Pivot.
The model used in the third way says that everyone is able to collaborate with each other. This is the power of the Power Platform. The very same logic is used by Power BI, Power Apps,and Power Automate.
Why Power BI?
Think of the legacy system, wherein you have your data in SQL Server and you wish to surface the respective data in excel or Power BI. Earlier, there was no way to do this but now with Power BI, you can pull the data and the data image from SQL Server, Azure SQL Server, or the SQL Server on-premises. You can break the silos, so all the end users are able to see the entire data that is from the SQL Server and you can have some intelligence for that. Since this is for everyone, all are able to have a rich data experience with the AI. The Power BI carries a lot of AI components that could be used, and the best part is that the Power BI and the Power platform is composed of a very controlled and secure environment that ensures the safety of the data.
What benefits does Power BI offer?
- Power BI Desktop is free
- Real Time Dashboards and Interactive Reports
- Natural Language Query and AI Insights
- Custom Visualisation and Custom Connectors
- Integration with Excel, PowerPoint, SharePoint and Teams
Power BI Desktop is free
Power BI is free, so you can have a report and don’t need to buy anything.
Here you can create your own report, breaking down the data silos in your organisation making use of multiple data sources. Power BI Desktop provides you with out of the box connectors to connect to hundreds of data sources, the ability to easily shape your data with various transformations by the click of a button, and combine multiple data sources into a data model. Power BI Desktop allows you to enhance your data model with business calculations.
Finally you can create interactive reports to get insights on your data.
Real Time Dashboards and Interactive Reports
Real-time dashboards provide a live 360 view of your business, so you can run it in real time instead of looking in the rearview mirror. Power BI provides you with various mechanisms to create real-time dashboards.
Assume that you are working in a manufacturing industry and want to perform some temperature checks about the radiation occurring, then it will give you the real time information. When we think of the IoT devices, the smarthomes, this gives us a dashboard which is way too interactive.
Natural Language Query and AI Insights
Here, we may have some questions and answers, so these questions can be easily analysed and shown to the end users. This is an amazing tool that we can develop without writing even a single line of code.
Natural Language Query: Ask questions, get answers – in beautiful, interactive visuals.
Natural Language Interface: With Power BI, we continue to find new ways to simplify how people analyse and gain insight from data, providing industry leading features such as natural language query. Natural language query provides users with an easier way to interact with their data, allowing them to type questions of their data and receive answers in the form of live visualisations.
250+ Custom Visuals
Power BI does have multiple out of box visuals, wherein it is possible to integrate with other systems and visuals. These are the certified visuals that Microsoft and the community people created and could be used by them. You can have more than 250+ visuals and you don’t have to rely on a single one.
Integration with Excel, PowerPoint, SharePoint and Teams
- You can analyse in Excel, get Excel data into Power BI to create interactive reports, and pin Excel reports in the Power BI dashboards.
- Export to PowerPoint – enables your data insights to be part of your PowerPoint deck.
- Integrate with Teams – add Power BI reports in Teams, make Power BI interactive part of your meeting and group of members within your team.
- Integration with SharePoint, and ability to embed Power BI in SharePoint sites.
Power BI Editions
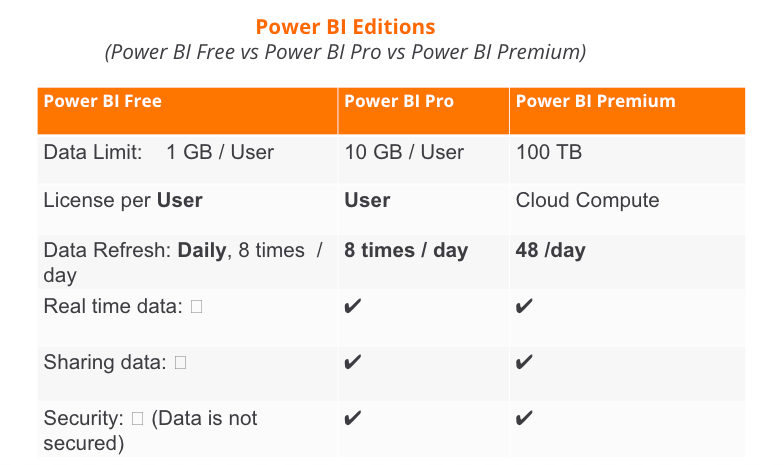
Power BI has 3 main editions:
- Free Edition: This offers a data size of 1 GB per user, a per user licence, that is not recommended because it does not offer real time data and security.
- Pro Edition: Here you can have 10 GB data per user, a per user licence, be it 10 users or thousand users, but since it is a pool data, it carries security and sharing.
- Power BI premium: This carries 10 TB, but this is actually hosting a server, so you purchase this from Microsoft and it will maintain your Power BI server, making it more secure and easy to maintain.
The mentor recommends the Pro Edition.
Building Blocks of Power BI
- Visuals: Card Visual, Pie Chart, map and more.
- Data Set: Excel, SharePoint, Azure SQL.
- Report: Detailed Information.
- Dashboard: Minimum Information for the end users.
Conclusion:
This marks the completion of the concepts discussed. For the real life scenario and the Hands-on-Demo, refer to the Webinar link
Keep learning!
- Top 25 DevSecOps Interview Question and Answers for 2024 - March 1, 2023
- How to prepare for VMware Certified Technical Associate [VCTA-DCV] Certification? - February 14, 2023
- Top 20 Cloud Influencers in 2024 - January 31, 2023
- 25 Free Question on SC-100: Microsoft Cybersecurity Architect - January 27, 2023
- Preparation Guide on MS-101: Microsoft 365 Mobility and Security - December 26, 2022
- Exam tips to prepare for Certified Kubernetes Administrator: CKA Exam - November 24, 2022
- Why do you need to upskill your teams with the Azure AI fundamentals? - October 11, 2022
- The best employee retention strategy for IT industries – UPSKILLING - September 26, 2022