Imagine a manager asking their team,
“Can any of you build us a live sales dashboard connected to our Azure warehouse and present it to the leadership team on Friday?”
Silence.
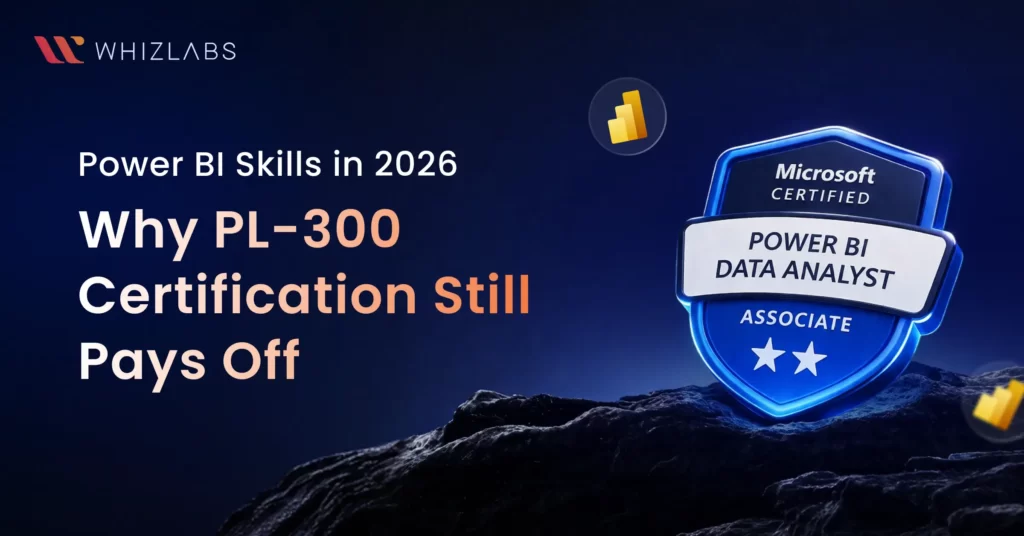
What most teams have today is access to data. What they still struggle with is using it properly. That gap is exactly why Power BI skills haven’t gone anywhere in 2026. For many learners, this is also why the PL-300 Power BI Data Analyst certification continues to be one of the most practical entry points into analytics roles.
This blog is not going to define what Power BI is. It is going to present hard evidence for why Power BI is indispensable in today’s job market, and how the path to becoming an expert is made with labs, not lectures.
The Growing Power BI Global Market
Business Intelligence has become the decision-making infrastructure of modern organisations. Consider the scale:
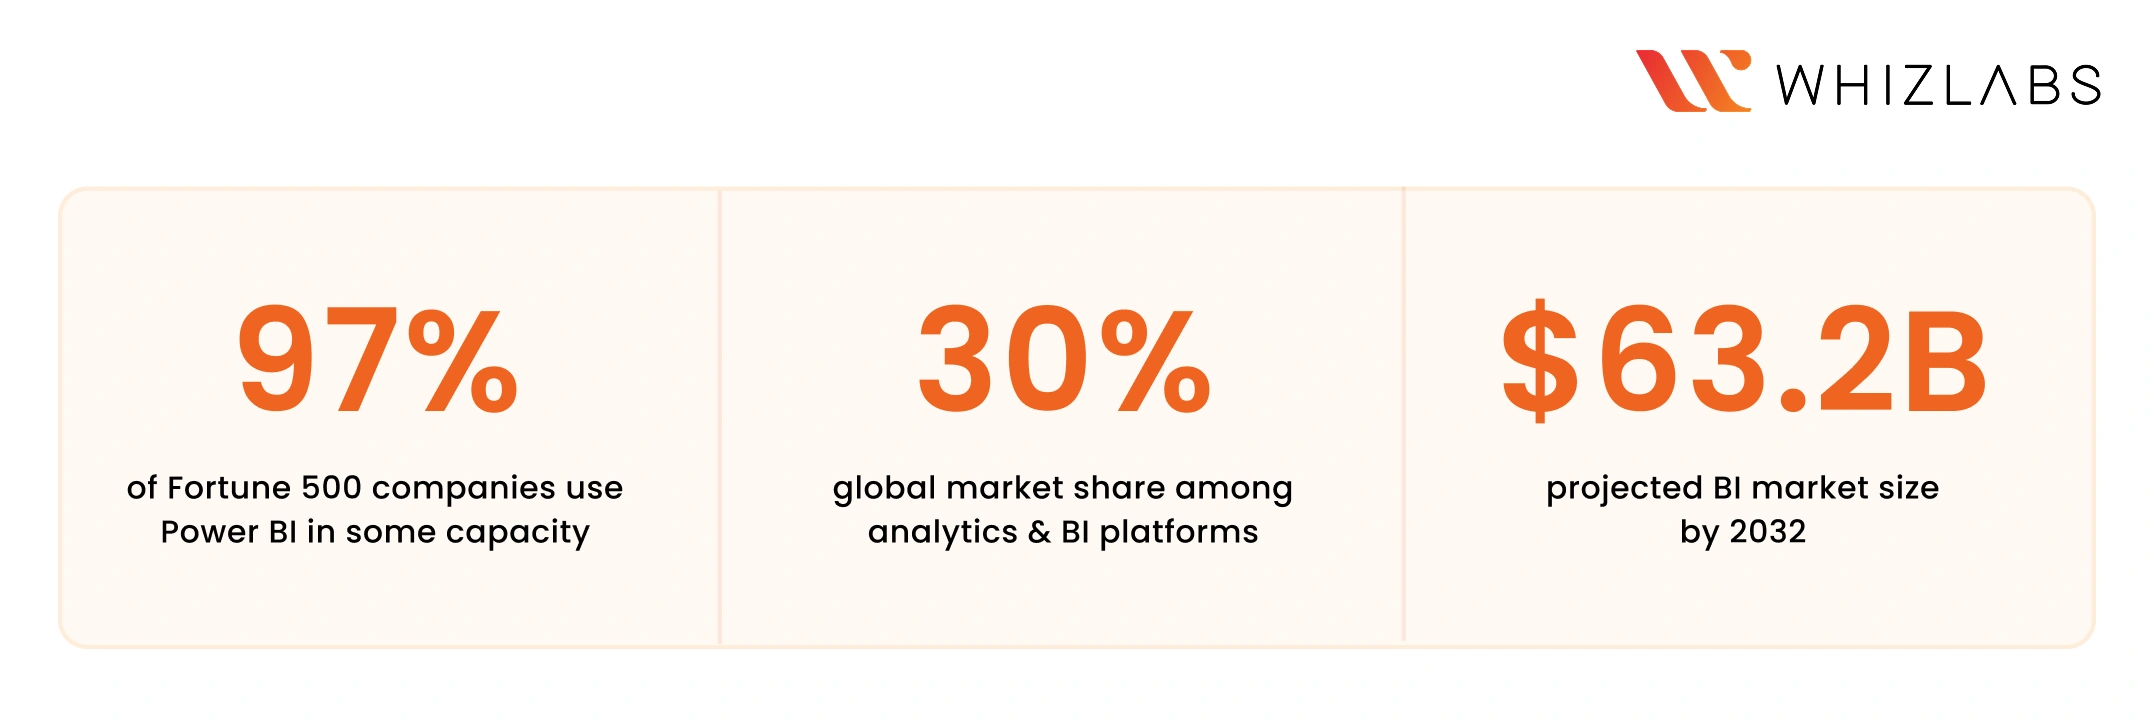
That market share number matters enormously.
Three out of ten analytics decisions made in enterprises today happen inside a Power BI report.
The BI market itself is expected to nearly triple from $24.82 billion in 2021 to $63.2 billion by 2032, with no sign of slowing.
And crucially, job postings requiring Power BI skills have grown 25% year-over-year in the business analytics field.
What Employers Are Asking For in 2026
These are the Power BI data analyst skills that employers consistently evaluate during hiring in 2026.
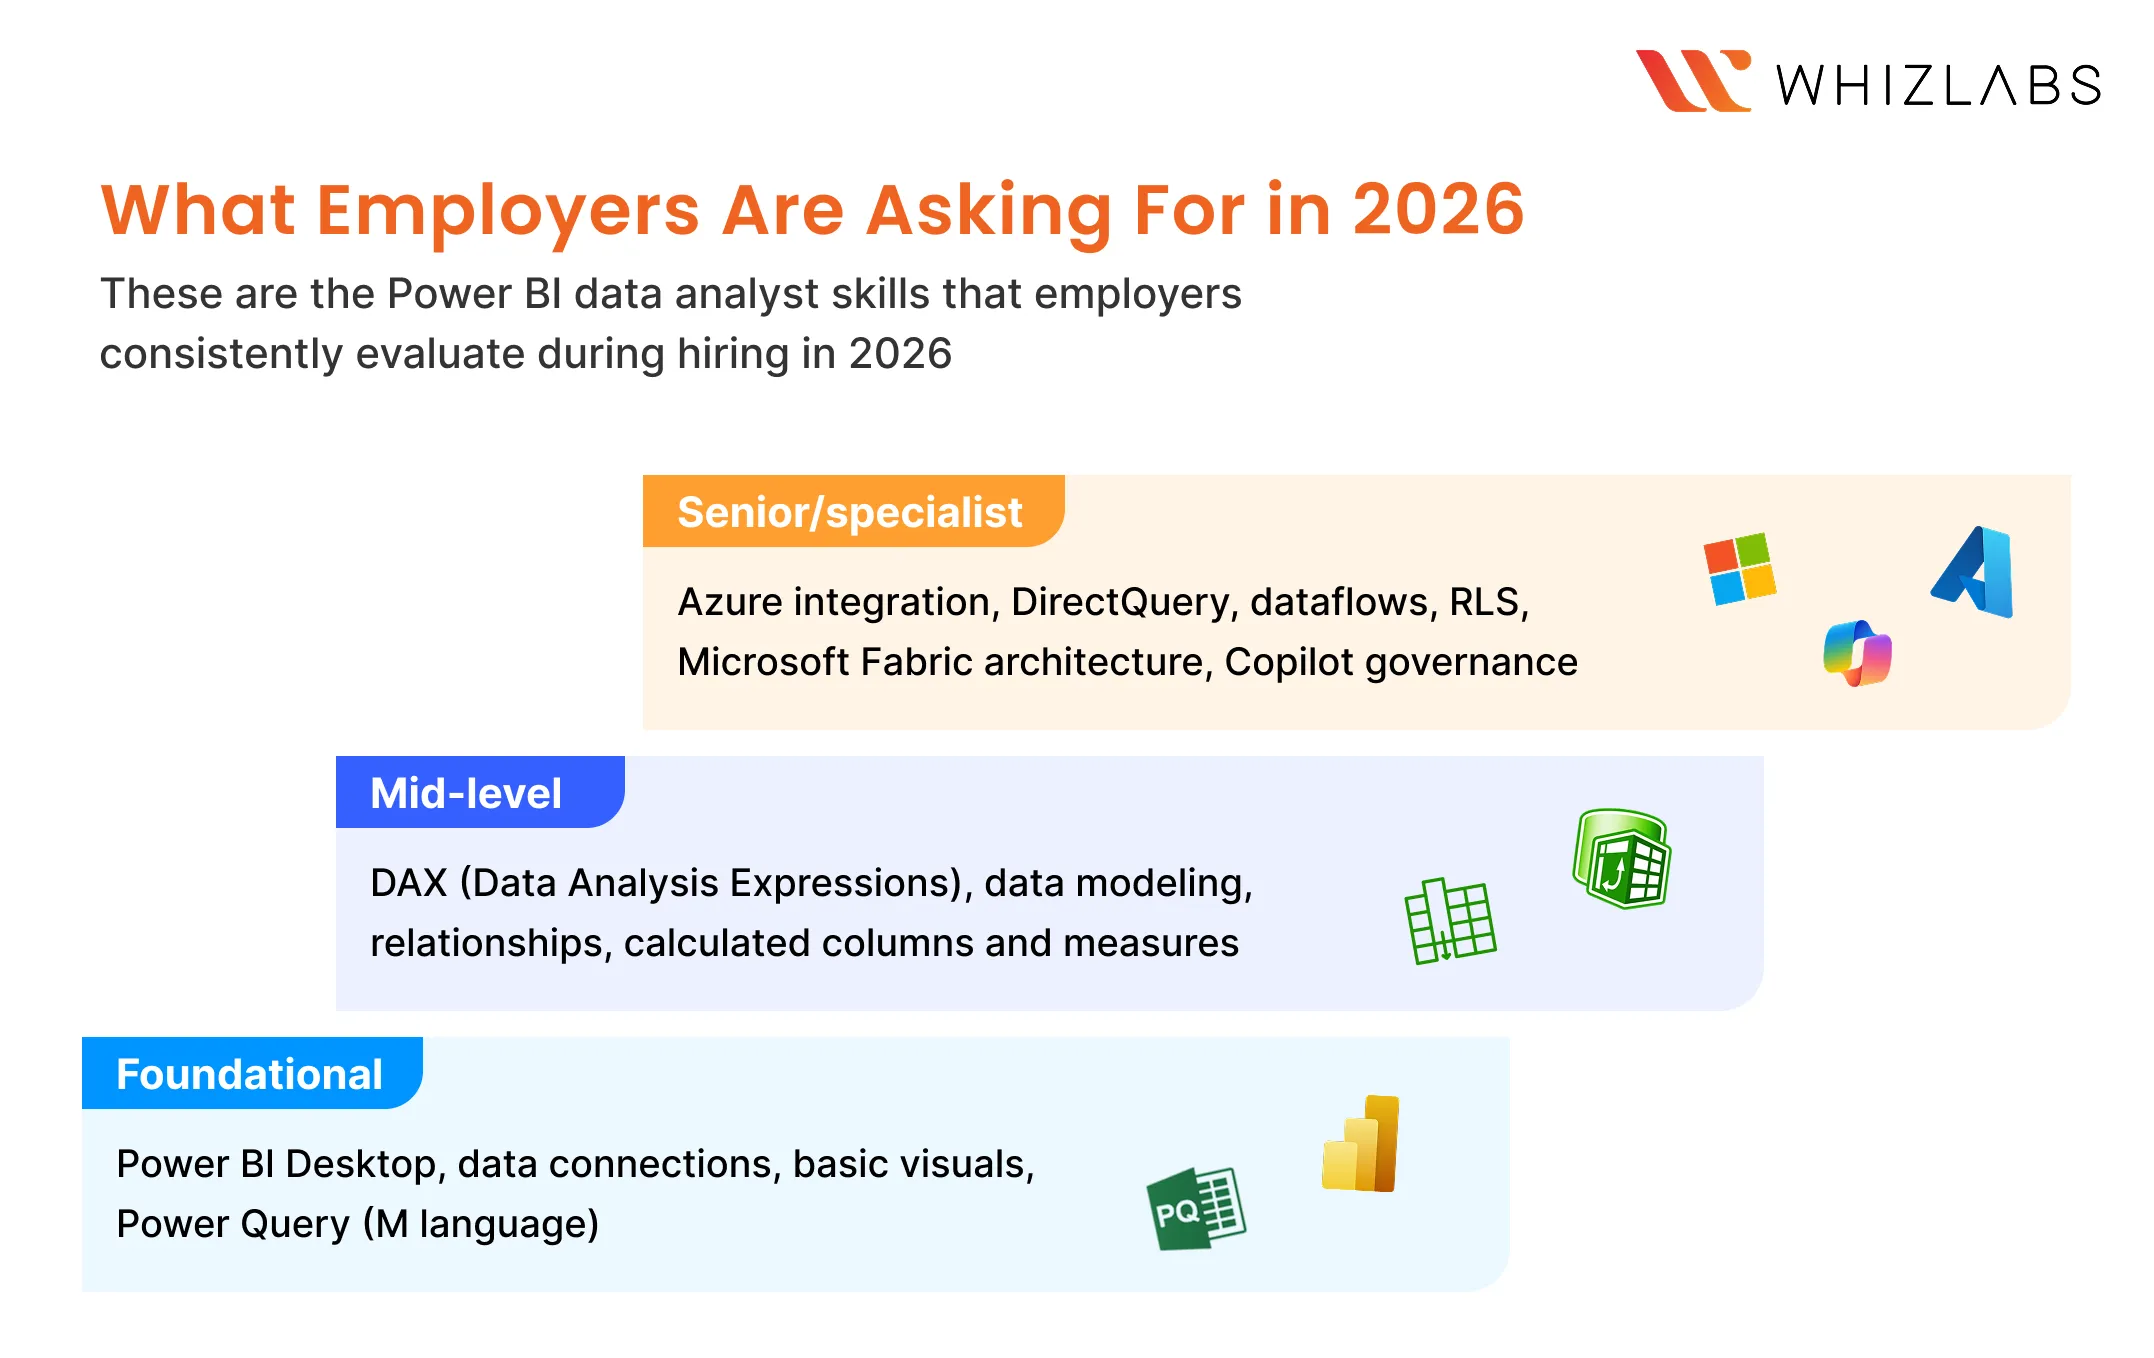
- Foundational: Power BI Desktop, data connections, basic visuals, Power Query (M language)
- Mid-level: DAX (Data Analysis Expressions), data modeling, relationships, calculated columns and measures
- Senior/specialist: Azure integration, DirectQuery, dataflows, RLS, Microsoft Fabric architecture, Copilot governance
LinkedIn job trends continue to show consistent demand for Power BI roles, especially in mid-sized and enterprise environments.
In 2026, a Power BI Developer gets one of the highest packages in the market.
- Entry-Level Power BI Developer: $65,000 – $85,000 per year.
- Mid-Level Power BI Developer: $90,000 – $120,000 per year.
- Senior Power BI Developer: $125,000+ per year.
- Freelance/Contract Power BI Developers: $50 – $100 per hour.
How Power BI Has Evolved in 2026
One common mistake people make in 2026 is thinking Power BI is still just a dashboard tool.
But now it is part of something much bigger: Microsoft Fabric. Fabric brings data engineering, data science, and analytics into one place.
Power BI reports now connect directly to OneLake (Microsoft’s unified data lake). In Direct Lake mode, Power BI can now query large datasets faster without duplicating data or relying heavily on imports.
What this means in practice is simple:
- Data doesn’t need to move across multiple tools anymore.
- Analysts and engineers are working on the same data layer.
- Reports connect more directly to source data.
At the same time, features like Copilot are changing how quickly work gets done.
You can generate visuals, suggest measures, and summarize reports much faster than before. But Copilot works on top of the data you provide. If the model is incorrect, the output will still be incorrect. If relationships are poorly defined, the insights won’t make sense. Speed has improved, but responsibility hasn’t gone away.
This is why the real change is not in the tool itself, but in what is expected from the person using it.
Power BI vs. The Competition: Tableau, Looker and Qlik
There are other BI tools like Tableau, Looker, and Qlik, each with strong capabilities and dedicated user bases. Tableau is often known for its visual flexibility, Looker fits well in Google Cloud environments, and Qlik is powerful when working with complex data relationships.
But when you look at how companies actually choose between them, the decision rarely comes down to their features alone. Most organizations already have an existing ecosystem like Microsoft or Google Cloud and they tend to choose tools that fit into that environment with the least friction. Factors like cost, ease of adoption, team familiarity, and integration with existing systems usually matter more than feature comparisons.
Here’s a simple way to look at how these tools compare in 2026:
|
Tool |
Strength | Market Fit |
2026 Outlook |
| Power BI | Microsoft ecosystem, price | Enterprise, mid-market | Strong – Fabric integration |
| Tableau | Visual flexibility | Data-heavy orgs | Stable – Salesforce ownership |
| Looker | LookML, Google Cloud | GCP-native companies | Niche but powerful |
| Qlik | Associative engine | Complex data relationships | Specialist positioning |
Power BI has one big advantage: It can easily live inside the Microsoft 365 ecosystem.
Microsoft’s ecosystem is deeply embedded across organizations:
- Excel for day-to-day work
- Azure for data infrastructure
- Teams and SharePoint for collaboration
- Fabric (now) for unified analytics
For this ecosystem, Power BI is the path of least resistance.
That means:
- easier adoption for teams
- faster deployment for companies
- more job demand compared to niche tools
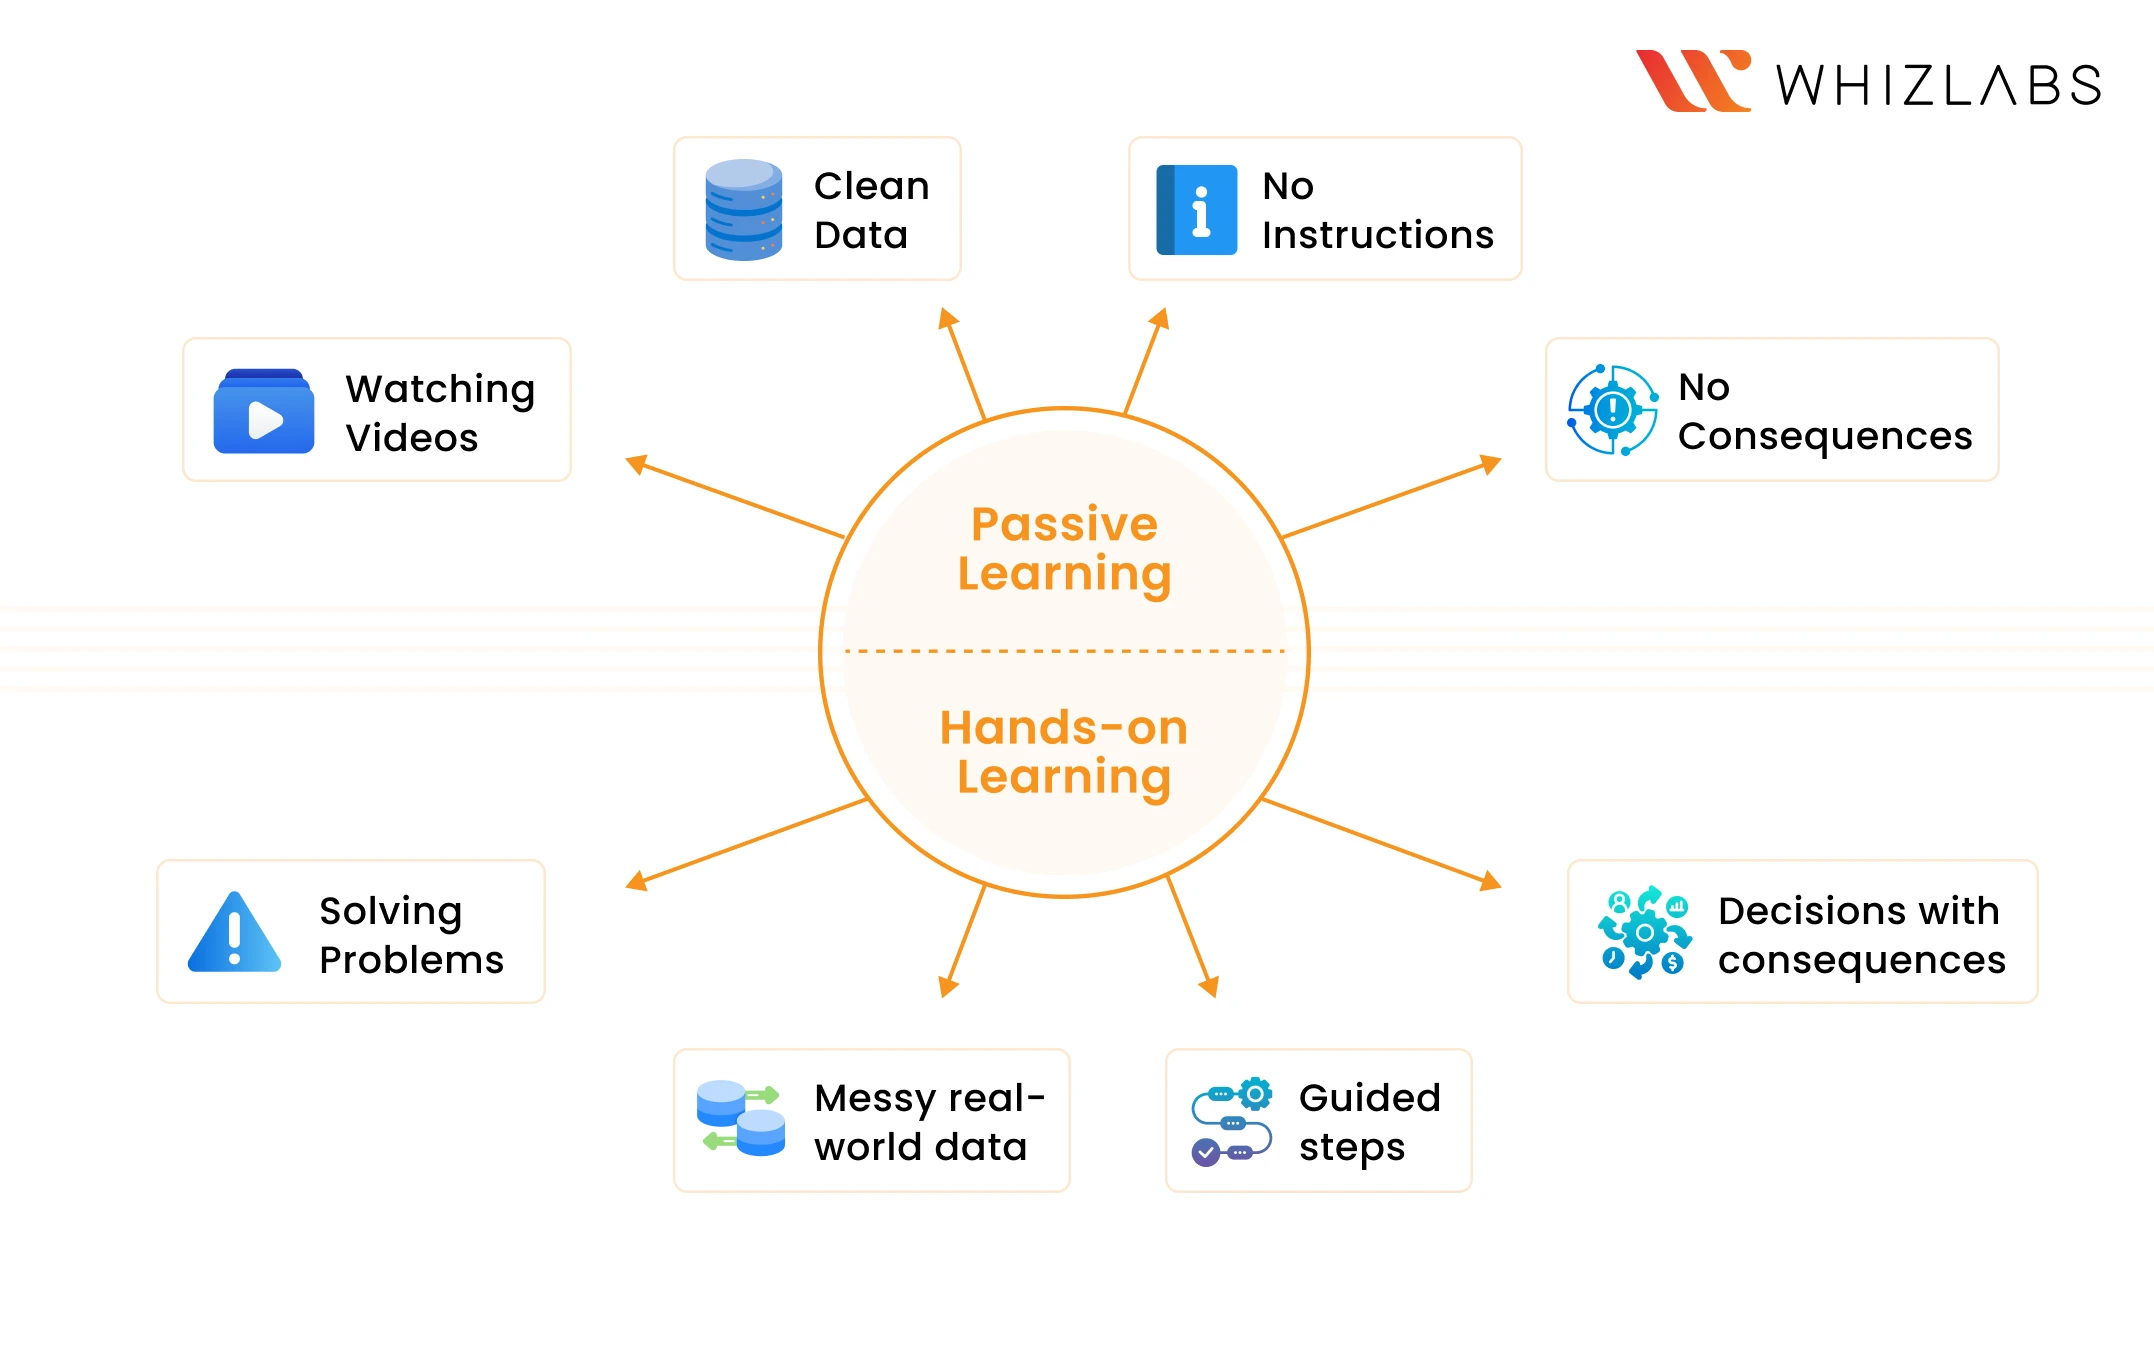
Power BI Hands-On Learning: Where Labs Beat Tutorials
A few years ago, being able to build a dashboard was considered a strong skill. In 2026, that is the baseline.
Watching a 4-hour course and completing it feels like progress. But the moment you’re asked in an interview to write a CALCULATE expression from scratch, or explain the difference between a star schema and a snowflake schema, that confidence starts to drop.
Because watching is not the same as solving.
This is where hands-on practice becomes important.
Labs force you to make real decisions with real consequences. A broken DAX formula does not give you an error message with a solution; it gives you wrong numbers. Learning to catch that, debug it, and fix it is what hiring managers are actually evaluating. This shift is where many learners struggle.
And now the important question is: How should you actually practice?
A Practical Lab Path to Build Power BI Skills
If you’re looking for a structured Power BI certification study guide, the path below gives you both the theory and the practice needed actually to perform in real projects.
Where to Learn
Microsoft Learn (free, official): The PL-300T00 path covers everything from basics through data modeling, DAX, and deployment. The DP-605T00 path handles Microsoft Fabric and enterprise reporting. These two paths cover all four foundational stages, so bookmark both now and work through them progressively.
Whizlabs Video Courses and Hands-on Labs (structured, exam-aligned, practice): If you absorb video better than documentation, the Whizlabs Power BI video course is worth starting here. Choose Whizlabs Power BI Masterclass course if you want to cover end-to-end materials in Power BI. If you want to go towards certificate preparation, start with PL-300 course materials. Many learners find this easier to follow than self-navigating Microsoft Learn.
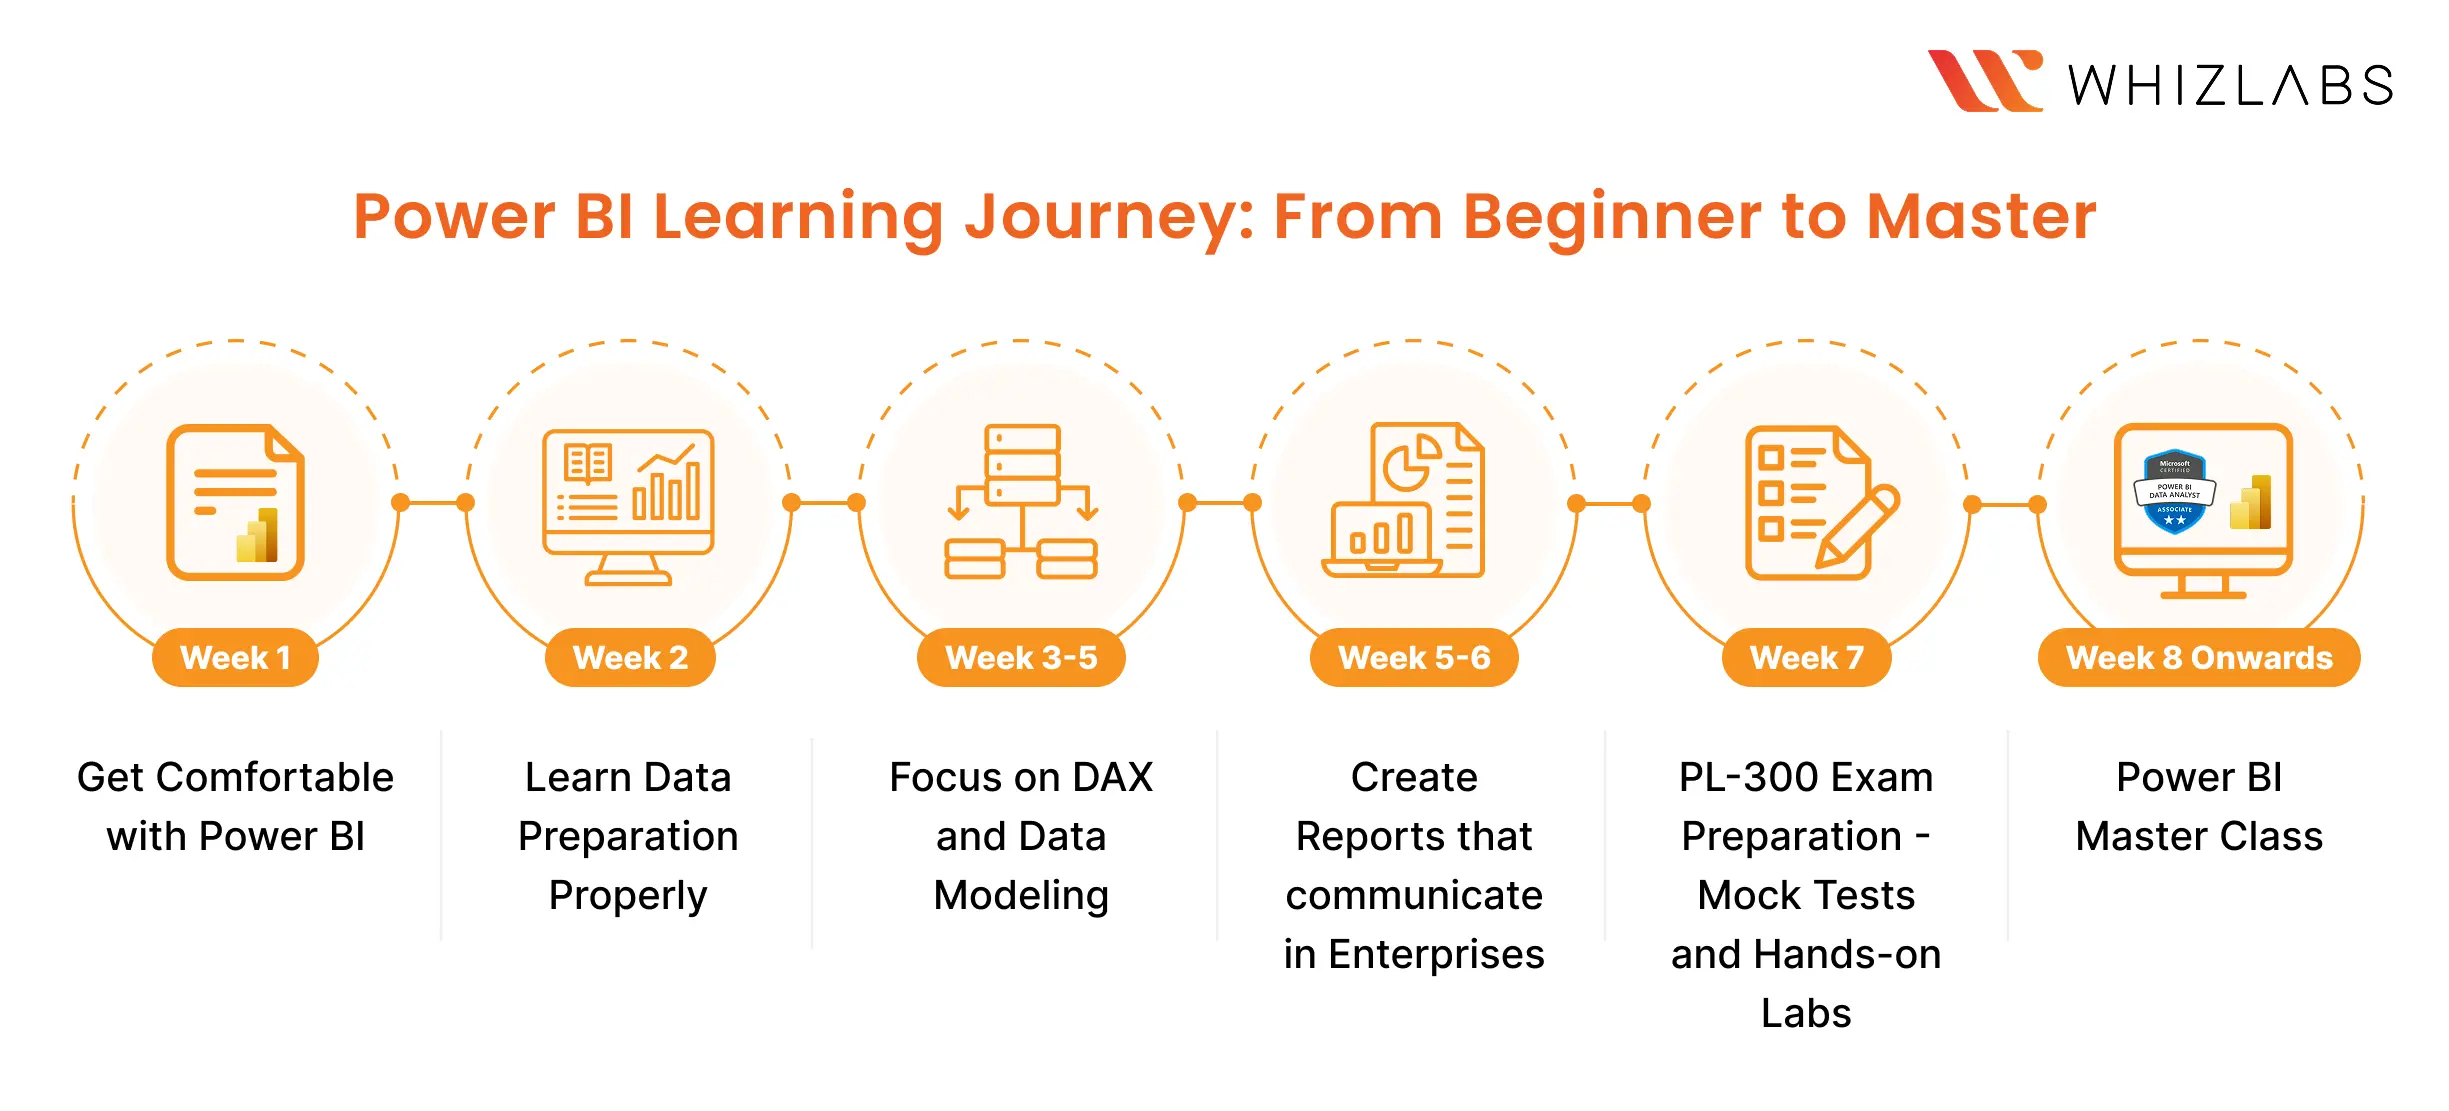
8 Weeks Study Plan
Week 1: Get Comfortable with Power BI
Your goal this week is not to master anything. It’s to get familiar.
- Open Power BI Desktop
- Import a simple dataset (sales, marketing, anything public)
- Build a basic report with 2–3 visuals
- Try filters, slicers, and simple transformations
Whizlabs Labs this week:
- Create a Dashboard in Power BI (45m)
- Report Designing in Power BI (1h)
Week 2: Learn Data Preparation Properly
Power Query is where most learners skip ahead and regret it. This stage covers data extraction, transformation, storage modes, and column profiling.
- Work on cleaning messy datasets
- Use Power Query to transform data
- Understand how tables connect
- Document every transformation step
Continue through PL-300T00 on Microsoft Learn. If you’re on the Whizlabs video track, the data preparation modules sit in the early sections of the course.
Whizlabs Labs this week:
- Transforming Data in Power BI – Part 1 (45m)
- Transforming Data in Power BI – Part 2 (45m)
Weeks (3–5): Focus on DAX and Data Modeling
Now you move into the core skill.
- Write basic DAX measures (SUM, CALCULATE, COUNT)
- Create relationships between tables
- Understand how filters affect your data
- Build one report that uses multiple tables
This is the stage where most interviews focus. Spend time here.
Whizlabs Labs this week:
- Data Model Designing in Power BI – Part 1 (45m)
- Data Model Designing in Power BI – Part 2 (45m)
Week 5–6: Create Reports That Communicate In Enterprises
A correct data model with a poorly designed report still fails in front of stakeholders. This stage is about turning your model into something people can actually use and understand.
- Build core chart types and apply consistent formatting
- Add drill-throughs, bookmarks, and interactive elements
- Create complex and advanced visualizations for real business scenarios
- Design reports with performance and user experience in mind
Whizlabs Labs this week:
- Creating Visualisation in Power BI (1h)
- Creating Complex Visualizations in Power BI (1h)
- Creating Advanced Visualizations in Power BI (1h)
Week 7: PL-300 Exam Preparation – Mock Tests and Hands-On Labs
This week you stop learning new things and start sharpening what you already know under exam conditions.
- Attempt section-wise mock tests and review every wrong answer
- Work through hands-on lab scenarios under time pressure
- Troubleshoot broken models and incorrect DAX outputs
- Only move to Week 8 when mock test scores are consistent
The Whizlabs PL-300 prep bundle includes mock tests, section-wise practice, and lab environments that simulate real exam scenarios. Do not skip the mock tests. They expose gaps that self-study consistently hides.
Week 8 Onwards: Power BI Masterclass
Once you are certified, the next move is positioning yourself for senior-level roles. The Whizlabs Power BI Masterclass covers complex DAX patterns, enterprise data models, and real business use cases, the skills that take you from analyst to solution architect.
This is your bridge from “I can build a dashboard” to “I can own an analytics solution end to end.”
Preparation Material Links:
🔗 Whizlabs: PL-300 Practice Tests and Hands-On Labs
🔗 Whizlabs: PL-300 Microsoft Power BI Data Analyst
🔗 Whizlabs: Microsoft Power BI Masterclass
🔗 Microsoft Learn: PL-300T00 Course
🔗 Microsoft Learn: DP-605T00 Path
What Power BI Means for You Right Now
If you are a student:
You have a window that professionals do not. You can invest 6 months in structured learning without a day job competing for your attention. At the end of 6 months, plan to have a PL-300 certification and two portfolio projects built from scratch: one with a real or simulated dataset, one using Fabric.
This will make you stand out against experienced candidates who only have theoretical learning to show in interviews.
If you are a fresher:
Your employer is not expecting perfection. They are evaluating whether you can learn fast and apply independently. Showing up with lab-completed projects and an understanding of how Power BI fits into a data pipeline is an enormous signal. It tells them you are ready to work on real projects.
If you are experienced but Power BI is not yet in your toolkit:
Many of the industries actively hiring for Power BI roles, such as healthcare, finance, retail, SaaS and government, rely heavily on domain knowledge.
That domain knowledge, combined with Power BI proficiency, is a genuinely rare pairing. Recruiters explicitly flag it as a premium skill set, and companies always try to retain you.
How Long Will the Market Wait?
Here is what the data actually shows about timing: the BI market does not wait. The talent shortage is real today, which means the opportunity is real today. In 12 months, more people will have caught up. The gap will narrow.
Consider this:
- Lightcast data shows that close to 325,510 jobs posted in a single two-year window required Power BI skills.
- LinkedIn currently lists tens of thousands of live Power BI vacancies with hundreds added every week.
These are not future projections. These are open roles right now, waiting to be filled by people who made a decision earlier than the person next to them.
Final Word: Practice Is the Point
The mistake most people make is waiting until they feel ‘ready enough’ to start. They plan to read more, and watch more, and in doing so, they don’t learn much and think they can’t do it. The BI world rewards people who build things over people who study things.
Here is the clearest advice this blog can offer: pick one dataset you find genuinely interesting. Open Power BI Desktop. Connect to it. Break something. Fix it. Build a report. Publish it. Then do the Microsoft Learn paths above with that same sense of purpose.
The Microsoft Learn paths and Whizlabs labs in this blog can be your direct path. Start today, before you feel ready.
FAQ
1. Is Power BI certification worth it in 2026?
Yes, but only if it is backed by real skills. In 2026, employers are looking for candidates who can demonstrate Power BI data analyst skills, including data modeling, DAX, and report building. A certification like PL-300 adds value when combined with hands-on projects and practical experience.
2. How to pass the PL-300 exam in 2026?
The most effective way to pass the PL-300 exam is to combine structured learning with hands-on practice. Use real datasets, practice under time constraints, and attempt mock tests. The PL-300 exam study guide and preparation tips can come in handy while preparing for the exam.
3. Where can I find PL-300 practice labs online?
Hands-on platforms like Whizlabs provide Power BI hands-on learning through lab-based exercises, mock tests, and scenario-driven tasks. These help you practice working with real data and prepare for both the exam and job roles.
Still have questions? Drop us an email at [email protected]. We will sort it out.
- 10 AWS Security Projects SCS-C03 Candidates Should Build - July 10, 2026
- Microsoft’s Latest AI Launches: Are We In the Agent Era? - June 26, 2026
- What Career Does MLA-C01 Lead To? Read This Before You Start - June 18, 2026
- What Is Agentic AI? And Why NCP-AAI Is the Cert for It - June 4, 2026
- Who Should Take AB-100 Certification? Beginner or Professional? - May 14, 2026
- How to Pass Cloud Certifications While Working Full-Time - April 28, 2026
- Is Power BI Worth Learning in 2026? PL-300 Guide - April 21, 2026
- Cloud Sandbox vs Personal Cloud Account – Which One to Use? - April 9, 2026